
MSAZ-321 · Lesson 1 of 12 · 21 min
Real-time intelligence concepts
▶ Video coming soon A video version of this lesson is on the way.
On Monday, October 26, at nine in the morning, Ines Duarte and Nikolai Petrenko held the first of what Nikolai called operations sessions. The engineering afternoons with Nikolai were about getting data into the Finch Data Hub; these mornings were about the other half of a data engineer's job in the DP-700 outline: watching data that arrives continuously, and watching the loads themselves so that problems are found before store managers find them. The first topic was a question Elena Brandt had put to them the week before: Ames had lost a freezer's worth of ice cream and frozen food on Saturday, October 17, and she wanted to know whether the hub could have warned anyone in time.
The store's 14 refrigeration units, nine freezers numbered F-01 to F-09 and five coolers numbered C-01 to C-05, had been fitted with temperature sensors in late September. Each sensor sends a reading every ten seconds to an Azure IoT Hub, and since October 1 the facilities contractor had routed every message to a container in Azure Blob Storage as a raw archive. Nobody looked at the archive. When the opening shift arrived at 7:40 a.m. on October 17, freezer F-06 read minus 2 degrees; its compressor had failed during the night, and stock worth about 3,900 dollars was thrown away. Nikolai's answer to Elena was careful: the hub could not have prevented a compressor failure, but it could make sure someone knew within minutes rather than hours.
What real time means
Real time is a phrase that means very different things to different people, so the first step in any design is to put a number on it. Nikolai drew four rows on the whiteboard. Batch means data arrives on a schedule, such as the nightly sales load at 1 a.m., and a delay of hours is acceptable. Near real time means a delay of a few minutes, such as the mirrored Finch Rewards tables, which arrive within about two minutes of a change. Real time, in the sense Fabric uses it, means seconds: an event is queryable and can trigger an action shortly after it happens. Hard real time, in the engineering sense of guaranteed response within milliseconds, such as a machine's safety cut-out, belongs in the equipment itself and never in an analytics platform.
| Latency class | Typical delay | Hub example | Usual Fabric tool |
|---|---|---|---|
| Batch | Hours | Nightly sales from StockLine | Pipelines, notebooks, warehouse procedures |
| Micro-batch | Minutes | Copy job for small reference tables | Copy jobs, scheduled notebooks |
| Near real time | About a minute or two | Mirrored Finch Rewards tables | Mirroring, change data capture |
| Real time | Seconds | Freezer readings and alerts | Eventstreams, eventhouses, Activator |
| Hard real time | Milliseconds, guaranteed | A compressor's own high-temperature cut-out | Not an analytics platform |
The right class comes from the decision the data supports, not from the technology. A store manager reading yesterday's sales gains nothing from second-by-second updates, and paying for them would waste capacity. A freezer warming up is different: the value of the information falls quickly, because every hour of delay brings the stock closer to the point where it must be discarded. Nikolai's rule was the same one he had used for the batch loads: choose the slowest pattern that still supports the decision, because slower is cheaper and simpler.
The Real-Time Intelligence workload
Fabric groups its streaming tools into a workload called Real-Time Intelligence. It is not one item but a set of items that work together, and DP-700 expects candidates to know what each one does and where it fits. The Real-Time hub is the catalog: a single place in the Fabric portal that lists every data stream the user can see, including eventstreams, KQL tables and Fabric and Azure events, and lets the user connect new sources. Eventstreams ingest events, process them lightly and route them to destinations, as MSAZ-320 showed. Eventhouses store events and serve fast queries over them; each eventhouse contains one or more KQL databases. KQL querysets hold saved queries written in Kusto Query Language. Real-Time dashboards display the results of KQL queries as tiles that refresh as data arrives. Activator watches data for conditions and takes actions, such as sending a Teams message or running a pipeline.
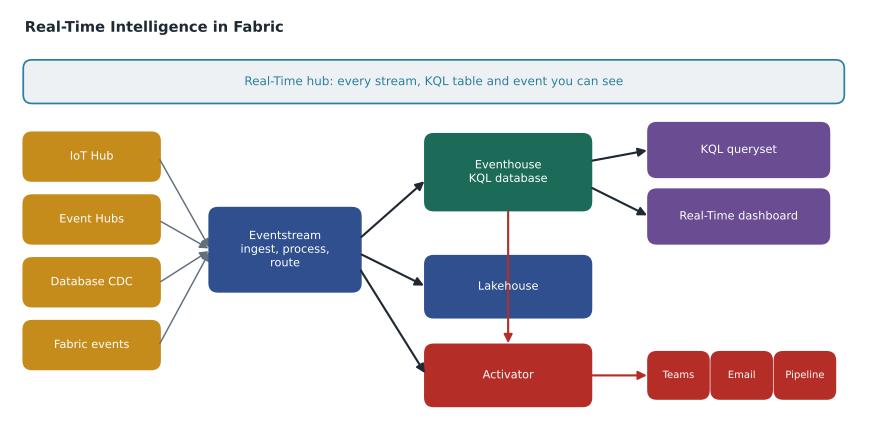
Each part can be used alone. A team can query an eventhouse filled by a nightly batch, build a dashboard on a KQL database that an application writes to directly, or have Activator watch a Power BI report. The value comes from combining them: an eventstream feeds an eventhouse, a dashboard shows the latest state and Activator alerts the people who need to act.
Events, streams and time
Streaming data is made of events: small records that describe something that happened at a moment, such as a temperature reading, a door opening, a card payment or a pipeline finishing. Events have three properties that shape every design. They are ordered by time, so queries almost always filter and group by time. They are append-only, so the stream is a growing log rather than a table that is updated in place. And they arrive continuously and sometimes out of order, because networks delay some messages more than others.
The last point matters more than beginners expect. Each freezer reading carries two times: the event time, when the sensor took the reading, and the ingestion time, when the reading reached the eventhouse. Usually the gap is a second or two, but a sensor that loses its wireless connection buffers readings and sends them in a burst when the connection returns. If a query groups by ingestion time, those buffered readings land in the wrong window. The rule is to group and alert by event time and to use ingestion time only to measure the delay itself.
| Property | What it means | Design consequence |
|---|---|---|
| Time-ordered | Every event has a timestamp | Filter and group by time first |
| Append-only | New events are added; old ones rarely change | Store as a log; summarize rather than update |
| Continuous | Data keeps arriving with no natural end | Aggregate over windows, not over all time |
| Sometimes late or repeated | Networks delay and retry | Use event time, allow lateness, remove duplicates |
Capacity and cost in real time
Batch loads use capacity in bursts: the nightly pipeline runs for about half an hour and then the capacity is free for reports. Real-time items behave differently. An eventstream that is running consumes capacity all the time, and an eventhouse that is receiving data stays active. Fabric suspends an eventhouse when it is not being used and wakes it on the next query or ingestion with a delay of a few seconds, which keeps idle eventhouses cheap, but an eventhouse receiving a reading every ten seconds never goes idle. A minimum capacity can also be scheduled for an eventhouse, in one-hour blocks across the week, when a guaranteed baseline matters more than the lowest cost.
For the trial, this did not matter; the trial capacity gave 64 capacity units until December 18. For the January pilot on an F16, it did. Nikolai's habit question, who reads this data and how fast do they need it, now had a cost attached: a design that keeps several items active around the clock takes a permanent slice of a capacity that also has to serve the nightly loads and the store managers' reports.
# How much of an F16 would always-on real-time items take?
capacity_cu = 16
items = {                    # average capacity units each item uses, around the clock (illustrative)
    "eventstream": 0.9,
    "eventhouse": 1.6,
    "activator": 0.2,
}
always_on = sum(items.values())
print(f"Always-on use: {always_on:.1f} CU of {capacity_cu}")
print(f"Share of the capacity: {always_on / capacity_cu * 100:.1f} in 100")
print(f"Left for loads and reports: {capacity_cu - always_on:.1f} CU")
seconds_per_day = 24 * 60 * 60
print(f"CU-seconds a day for real time: {always_on * seconds_per_day:,.0f}")Always-on use: 2.7 CU of 16 Share of the capacity: 16.9 in 100 Left for loads and reports: 13.3 CU CU-seconds a day for real time: 233,280
What this code does
The program takes the size of the planned capacity and Nikolai's rough estimates of how many capacity units each real-time item uses on average all day. It adds the estimates, shows that total as a share of the capacity and as what is left for everything else, and converts it to capacity-unit seconds per day, the unit the capacity metrics app reports. The output shows the real-time items would take a little under a sixth of the F16, which is affordable but large enough to plan for.
The output shows about 2.7 capacity units, roughly 17 in every 100 of an F16, used day and night. The figures were Nikolai's illustrative estimates, not measurements; he would replace them with real numbers from the capacity metrics app once the stream was running, which lesson 8 covers. The point for Ines was that real time is a standing cost, unlike a batch load that finishes and stops.
Choosing what to build
MSAZ-320 compared eventstreams, KQL and Spark structured streaming as engines for streaming transformations. In this course the question is broader: which combination of items answers each need. The freezer problem had three needs. Facilities wanted an alert within minutes when a unit warmed up. The store manager wanted a screen in the back office showing every unit's current temperature. And the facilities team wanted history, to spot units that were slowly getting worse and to show insurers what had happened. One design met all three: an eventstream to ingest and route, an eventhouse to hold every reading and answer queries in seconds, a Real-Time dashboard for the screen, Activator for the alert, and the hourly lakehouse table Ines had already built for long-term history.
| Need | Latency needed | Item that meets it |
|---|---|---|
| Alert when a unit warms up | Minutes at most | Activator rule on the stream |
| Back-office screen of current temperatures | Seconds to a minute | Real-Time dashboard on the eventhouse |
| Investigate an incident in detail | Interactive queries over weeks of readings | KQL queryset on the eventhouse |
| Long-term trends and insurance records | Hours are fine | Hourly lakehouse table, plus OneLake availability |
| Know when the stream itself stops | Minutes | Activator heartbeat rule |
The last row was Ines's addition, and Nikolai liked it. A monitoring system that fails silently is worse than none, because people trust it. If the sensors, the IoT Hub or the eventstream stopped sending, the freezer alert would simply never fire. A heartbeat rule, which fires when no readings arrive for a set time, guards against that.
What could have been known on October 17
Nikolai ended the session by turning Elena's question into a calculation. The raw archive held every reading, so once it was loaded into an eventhouse, which they would do the following week, they could find the exact moment F-06 began to warm. The facilities team said frozen food is safe while it stays at or below minus 12 degrees, so that was the threshold for an alert. If the alert used a ten-minute average to avoid firing on a door left open briefly, it would fire a few minutes after the average crossed the line.
Worked problem
How much warning would an alert have given?
Suppose F-06's ten-minute average first rose above minus 12 degrees at 2:50 a.m. on October 17, the alert takes 5 minutes to evaluate and deliver, and the on-call facilities technician needs 45 minutes to reach the store. The shift found the failure at 7:40 a.m. How much earlier could someone have arrived, and how long would the unit have been above minus 12 when they did?
Show solution
- Alert delivered: 2:50 a.m. + 5 minutes = 2:55 a.m.
- Technician arrives: 2:55 a.m. + 45 minutes = 3:40 a.m.
- Earlier than the shift: 7:40 a.m. − 3:40 a.m. = 4 hours.
- Time above the threshold on arrival: 3:40 a.m. − 2:50 a.m. = 50 minutes.
Answer: Someone could have been there about 4 hours earlier, after the unit had been above minus 12 for about 50 minutes, early enough to move stock into the other freezers.
The 2:50 a.m. figure was a placeholder until the archive was loaded; lesson 3 finds the real one. Elena's decision did not depend on the exact minute. Four hours is the difference between moving stock and throwing it away, and the pilot would be justified if the system worked once.
A word on scope
Ines asked whether the same tools would one day watch the tills. Nikolai said possibly, for fraud patterns or queue lengths, but not yet: the sales data had no real-time decision attached to it, and the hub's first job was to make the nightly loads dependable. That was the second theme of these sessions. Lessons 2 to 6 build the freezer solution; lessons 7 to 11 return to the batch hub and cover monitoring, optimization and troubleshooting, which make up about a third of the DP-700 exam; and lesson 12 reviews the whole freezer design before the January pilot.
Common mistakes
MistakeTreat real time as a goal in itself.
InsteadPut a number on the latency each decision needs and choose the slowest pattern that meets it.
MistakeGroup streaming data by the time it was ingested.
InsteadGroup and alert by event time; use ingestion time only to measure delay.
MistakeAssume a streaming item costs nothing when it is quiet.
InsteadAn item receiving data continuously stays active and uses capacity around the clock.
MistakeMonitor the freezers but not the stream.
InsteadAdd a heartbeat rule so a silent failure of the stream itself is noticed.
Summary and key terms
- Latency classes run from batch, through micro-batch and near real time, to real time in seconds; hard real time belongs in equipment.
- Real-Time Intelligence combines the Real-Time hub, eventstreams, eventhouses, KQL querysets, Real-Time dashboards and Activator.
- Events are time-ordered, append-only, continuous and sometimes late or repeated.
- Streaming items that receive data continuously use capacity all the time; idle eventhouses suspend and wake in seconds.
- Map each need to the item that meets it, including a way to notice when the stream stops.
- Real-Time Intelligence
- The Fabric workload for ingesting, storing, querying, visualizing and acting on streaming data.
- Real-Time hub
- The Fabric catalog of streams, KQL tables and events a user can see and connect.
- Eventhouse
- A Fabric item that stores event data in KQL databases and serves fast queries.
- Event time
- The time an event happened, recorded by its source.
- Ingestion time
- The time an event reached the store that holds it.
- Heartbeat rule
- An alert that fires when expected data stops arriving.
Practice problems
Work each problem on paper first, then reveal the answer to check.
Why did Nikolai reject second-by-second updates for the sales dashboard?
Show answer
No decision needs them, and slower patterns are cheaper and simpler.
Name four items in Real-Time Intelligence.
Show answer
For example the Real-Time hub, eventstreams, eventhouses and Activator; also KQL querysets and Real-Time dashboards.
Why should a freezer alert use event time?
Show answer
Buffered readings can arrive late, and grouping by ingestion time would put them in the wrong window.
What does a heartbeat rule protect against?
Show answer
The stream stopping silently, which would stop every other alert from firing.
Why is real time a standing cost?
Show answer
Items receiving data continuously stay active and use capacity all day.
Lesson quiz · 5 questions
Score 60% or more to complete this lesson.
Create a free account to save your progress, take quizzes and earn a certificate.