
MEC-499 · Lesson 9 of 12 · 21 min
Prototyping and testing
Analysis predicts; testing confirms or corrects. However careful the calculations in lesson 6, the TDX-150 would not be ready for the cooperative until a real skid had lifted real water, primed against a real suction lift, run for hours and been set up by real volunteers. This lesson covers the team's prototypes, from foam and cardboard to the full skid, the test plan, a designed experiment on priming, the performance and noise tests, and what the team did when one result failed.
Prototypes at every stage
Prototypes are not only the final machine. A prototype is any physical or virtual model built to answer a question, and the cheapest prototypes answer questions earliest. In week 5 the team built a cardboard mock-up of the control panel and asked two volunteers to 'start' it wearing winter gloves; the toggle switches were too small, and became large rotary switches. In week 8 Hannah 3D printed a quarter-scale model of the skid and canopy, which revealed that the lifting eye position blocked the radiator's upward airflow. In week 9 the team borrowed a vacuum pump and separator from Tidewater's stores and connected it to a clear acrylic tube to watch how the float valve behaved when water arrived suddenly, which led to the larger float chamber in the final design.
Each of these is a focused prototype: it tests one thing, cheaply and quickly. Professor Leger calls them 'questions you can hold'. The full prototype, assembled in weeks 16 to 18, is an integrated prototype: it tests whether everything works together, and it is the basis for verifying the requirements.
The test plan
Rafael wrote the test plan before the critical design review, so that the design could be checked for testability and the test equipment booked. The plan lists, for each requirement verified by test, the test procedure, the equipment, the measured quantities with their required accuracy, the acceptance criterion, the number of repeats and the person responsible. Writing it early exposed two problems. The TL-3 loop at Tidewater, described in the measurement course, can measure flow and head accurately but cannot create a suction lift. And nobody owned a way to measure noise to a standard method.
| Test | Requirement | Where and how | Acceptance |
|---|---|---|---|
| T-01 Performance | R-01 | TL-3 loop: flow by magnetic meter, head by pressure transducers, speed by tachometer | within the agreed band of 90 L/s at 18 m |
| T-02 Priming | R-02, R-03 | Tidewater yard: skid on a platform above a 3 m deep tank, hose to set lift | 120 s at 6.0 m, 180 s at 7.5 m |
| T-03 Solids | R-04 | TL-3 loop: rubber test spheres fed through the suction | passed without blockage |
| T-04 Run time | R-06 | 8 h run at rated point, fuel weighed before and after | scaled run time 24 h or more |
| T-05 Noise | R-07 | open yard: four positions at 7 m, class 1 sound level meter | energy average 75 dB(A) or less |
| T-06 Set-up | R-08 | three crews of two volunteers, timed from parked trailer to flow | 20 min or less for every crew |
| T-07 Cold start | R-09 | Tidewater environmental chamber, soaked overnight | starts and runs at −10 °C |
For priming, Owen arranged with Lucie Arsenault to build a test rig in Tidewater's yard: a steel platform beside a 3 m deep tank, with the skid lifted so that the vertical distance from the water to the pump inlet could be set to 4, 6 or 7.5 m by changing the platform height and the water level. For noise, Kwame borrowed a calibrated class 1 sound level meter from the university's acoustics lab and followed a simplified version of the standard method for measuring machinery noise outdoors: four positions on a circle at 7 m, hard reflecting ground, background noise checked to be at least 10 dB below the machine.
A designed experiment on priming
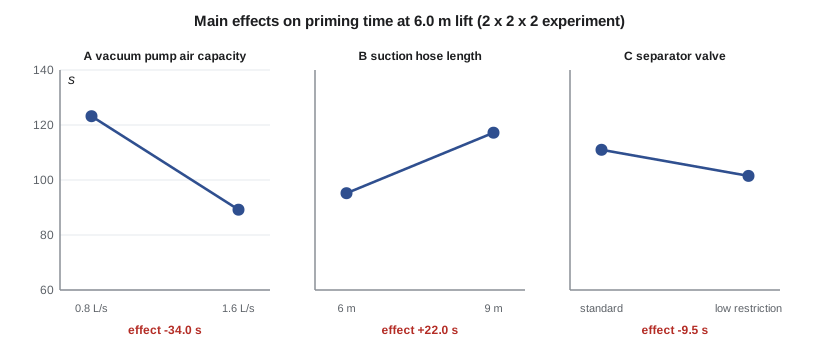
Priming time depended on several design choices the team had not been able to settle by analysis: the size of the vacuum pump, the length of suction hose the cooperative would use, and whether to pay extra for a low-restriction valve in the separator. Testing one factor at a time would have needed many runs and would have missed interactions. Instead the team ran a two-level full factorial experiment, the design of experiments method covered in the measurement course: three factors at two levels each, eight combinations, each run twice in random order to average out variation and protect against drift.
The main effect of a factor is the average response at its high level minus the average at its low level. Interaction effects measure whether one factor's effect depends on another's level. Each effect is computed as a contrast: the response values multiplied by plus or minus one according to the factor levels, summed and divided by half the number of runs.
# Prototype tests: a 2^3 factorial experiment on priming time, and the rated-point test result
import math, itertools
# Factors (low, high): A vacuum pump air capacity 0.8 / 1.6 L/s, B suction hose 6 / 9 m, C separator valve standard / low-restriction
runs = list(itertools.product((-1, 1), repeat=3))           # standard order: (A, B, C)
t = [118, 81, 139, 106, 109, 73, 127, 97]                 # priming time at 6.0 m lift, s (mean of two repeats)
runs = [(a, b, c) for c, b, a in runs]                     # A changes fastest
def effect(cols):
    s = sum(ti * math.prod(r[i] for i in cols) for r, ti in zip(runs, t))
    return s / 4
names = {(0,): "A vacuum pump size", (1,): "B suction hose length", (2,): "C separator valve",
         (0, 1): "AB", (0, 2): "AC", (1, 2): "BC", (0, 1, 2): "ABC"}
print(f"Mean priming time {sum(t) / 8:.1f} s")
for cols, n in names.items():
    print(f"  effect {n:22s} {effect(cols):6.1f} s")
best = min(zip(t, runs)); print("Fastest run:", best[0], "s at", best[1])

# Rated-point performance test on the TL-3 loop (flow, head and their expanded uncertainties, k = 2)
Q, uQ = 91.2, 0.6           # L/s
H, uH = 17.8, 0.12          # m
Q_req, H_req = 90.0, 18.0
# Translate the measured point along the system curve to compare with the guarantee: use a simple tolerance band
tolQ, tolH = 0.05, 0.03     # acceptance band on flow and head (illustrative contract values)
ok = (Q >= Q_req * (1 - tolQ) - uQ) and (H >= H_req * (1 - tolH) - uH)
print(f"Measured {Q} +/- {uQ} L/s at {H} +/- {uH} m  ->  {'within' if ok else 'outside'} the acceptance band")
# Noise: sound pressure at 7 m, four positions, energy average
Lp = [77.9, 76.4, 76.8, 77.3]
avg = 10 * math.log10(sum(10 ** (x / 10) for x in Lp) / len(Lp))
print(f"Energy-average sound level at 7 m: {avg:.1f} dB(A) against a 75 dB(A) limit")Mean priming time 106.2 s effect A vacuum pump size -34.0 s effect B suction hose length 22.0 s effect C separator valve -9.5 s effect AB 2.5 s effect AC 1.0 s effect BC -1.0 s effect ABC 0.5 s Fastest run: 73 s at (1, -1, 1) Measured 91.2 +/- 0.6 L/s at 17.8 +/- 0.12 m -> within the acceptance band Energy-average sound level at 7 m: 77.1 dB(A) against a 75 dB(A) limit
Doubling the vacuum pump's air capacity cuts priming time by 34 seconds on average, the largest effect. A 9 m suction hose adds 22 seconds over a 6 m hose, because there is more air to remove. The low-restriction separator valve saves about 9.5 seconds. The interactions are all small, within about 2.5 seconds, and comparable to the run-to-run variation the team saw in repeats, so the factors act essentially independently. With the larger vacuum pump, every combination met the 120 s requirement at 6.0 m lift; with the smaller one, the 9 m hose combinations failed. The team chose the larger vacuum pump and the low-restriction valve, giving 73 s with the standard 6 m hose and about 97 s with a 9 m hose, both comfortably within R-02.
Performance and the rated point
On the TL-3 loop, Lucie's group ran the pump at 1,800 rpm from shutoff to maximum flow and recorded the full curve. At the rated system condition the pump delivered 91.2 ± 0.6 L/s at 17.8 ± 0.12 m, with uncertainties at 95 percent confidence from the loop's calibrated instruments. The contract-style acceptance band the team had agreed with Farah allowed 5 percent on flow and 3 percent on head, allowing for measurement uncertainty, so R-01 passed. The measured efficiency was 67 percent against Tidewater's 68 percent, consistent within uncertainty.
At the priming rig, the skid primed at 7.5 m lift in 142 s and settled at about 68 L/s with the crackling sound of mild cavitation, just as the NPSH analysis predicted. R-03 required only priming at that lift, so it passed, and the measured flow went into the operator's manual as a limitation: at lifts above about 6.5 m, expect reduced flow.
When a test fails: noise
Noise was measured at four positions around the skid at 7 m, with the skid running at the rated point. The readings were 77.9, 76.4, 76.8 and 77.3 dB(A). Decibels cannot be averaged arithmetically, because they are logarithmic; the energy average converts each reading to relative energy, averages and converts back:
The energy average is 77.1 dB(A), 2.1 dB over the 75 dB(A) requirement. The rented unit had measured about 82 dB(A), so the TDX-150 is a clear improvement, about a third quieter in perceived loudness, but R-07 failed. The team's first instinct, Émilie admitted later, was to look for a reason to discount the result: a gust of wind, a truck passing on the road. The background readings ruled both out.
What the team did next is the important part. Kwame and Rafael took narrow-band readings around the canopy and found the loudest source was not the canopy panels, as the mass law analysis had suggested, but the radiator outlet on top and an unsealed gap where the suction pipe passed through the canopy wall, which together leaked noise in a direct line of sight to the measuring positions. Two changes were estimated to bring the level to about 74 dB(A): a short lined baffle on the radiator outlet, and a molded rubber boot sealing the pipe penetration. Both were cheap, but the boot had a three-week lead time, and the project had two weeks left. The fix could not be built and retested before the final review.
The team reported the failure honestly, with the measurements, the diagnosis, the costed fix and a retest date that Tidewater agreed to carry out after the course. Lesson 12 shows how this appears in the final report, and lesson 11 discusses why an honest report of a failed requirement is not a weakness but a professional obligation.
Other tests
The eight-hour run used 54.6 L of fuel, weighed before and after, or 6.83 L/h, within 1 percent of the prediction. Scaled to the 180 L usable, that gives 26.4 hours, meeting R-06. The solids test passed 76 mm rubber spheres without blockage. In the cold chamber, the engine started at −12 °C with its block heater unplugged, on the second attempt. Three crews of two volunteers, none of whom had seen the skid before a 30-minute briefing, set it up in 17, 19 and 15 minutes, all within R-08; the color-coded captive hose fittings were the most praised feature. The skid with a full tank weighed 941 kg on Tidewater's calibrated scale, 8 kg more than the budget but within the 950 kg (2,090 lb) limit, as the mass budget had warned it might be.
Worked problem
Energy-averaging sound levels
Two positions read 80 dB(A) and 74 dB(A). What is their energy average, and what is the arithmetic mean?
Show solution
- Convert to relative energy: 10^8.0 = 1.00 × 10⁸ and 10^7.4 = 2.51 × 10⁷.
- Average: (1.00 × 10⁸ + 0.251 × 10⁸)/2 = 0.626 × 10⁸.
- Back to decibels: 10 log(0.626 × 10⁸) = 77.97 dB(A).
- The arithmetic mean is 77.0 dB(A), which understates the energy average because the louder position dominates.
Answer: About 78.0 dB(A) by energy, versus 77.0 by simple averaging.
Test records
Every test produced a record: date, configuration of the skid (which vacuum pump, which hose), instruments with their calibration dates, raw readings, calculations, result and the names of who ran and who witnessed it. Marco Rossi reviewed the records for the performance and lifting tests and signed them as Tidewater's quality witness. Records like these are what turn a test into evidence. Without them, a claim that the pump delivered 91 L/s is just a claim.
Common mistakes
MistakeBuilding only one full prototype at the end.
InsteadUse cheap focused prototypes early to answer specific questions, then an integrated prototype to verify requirements.
MistakeWriting the test plan after the design is finished.
InsteadWrite it before the critical design review, so testability and equipment are settled in time.
MistakeChanging one factor at a time.
InsteadUse a factorial experiment to measure several effects and their interactions in few runs.
MistakeAveraging decibel readings arithmetically.
InsteadEnergy-average them, which gives weight to the louder readings.
MistakeLooking for reasons to discount a failed result.
InsteadCheck for real measurement problems, then diagnose the cause and report the failure honestly.
Summary and key terms
- Focused prototypes of the panel, layout and separator answered questions cheaply before the integrated prototype was built.
- The test plan, written before the critical design review, exposed the need for a priming rig and a noise method.
- A 2³ factorial experiment found vacuum pump size (−34 s), hose length (+22 s) and separator valve (−9.5 s) acted nearly independently.
- The rated-point test gave 91.2 L/s at 17.8 m within the acceptance band; the pump primed at 7.5 m but cavitated, as predicted.
- Noise measured 77.1 dB(A) against 75, failing R-07; the cause was the radiator outlet and an unsealed pipe penetration.
- Fuel use, solids, cold start, set-up and mass all met their requirements, with signed test records.
- Focused prototype
- A cheap model built to answer one specific question.
- Integrated prototype
- A complete working model used to verify requirements together.
- Test plan
- A document listing tests, procedures, equipment, accuracy, acceptance criteria and owners.
- Factorial experiment
- An experiment testing all combinations of factor levels.
- Main effect
- The average change in response when a factor moves from its low to high level.
- Interaction effect
- The degree to which one factor's effect depends on another factor's level.
- Randomization
- Running test combinations in random order to protect against drift.
- Energy average
- The decibel value of the mean of the sound energies of several readings.
- Acceptance band
- The agreed range within which a measured result meets a requirement.
- Test record
- The documented evidence of a test, including configuration, instruments and results.
Practice problems
Work each problem on paper first, then reveal the answer to check.
In a 2² experiment, responses are 40 (−,−), 30 (+,−), 50 (−,+) and 36 (+,+). Find the main effect of the first factor.
Show answer
(30 + 36)/2 − (40 + 50)/2 = 33 − 45 = −12.
For the same data, find the interaction effect.
Show answer
(40 − 30 − 50 + 36)/2 = −2.
Readings of 75, 75, 75 and 81 dB(A). Find the energy average.
Show answer
10 log((3 × 10^7.5 + 10^8.1)/4) = 77.4 dB(A).
An 8 h run uses 55 L. How long will 180 L last?
Show answer
180 / 6.875 = 26.2 h.
Why did the team run each factorial combination twice in random order?
Show answer
To estimate run-to-run variation and protect the effects against drift with time or temperature.
Lesson quiz · 5 questions
Score 60% or more to complete this lesson.
Create a free account to save your progress, take quizzes and earn a certificate.