
MEC-499 · Lesson 10 of 12 · 20 min
Project management, schedule and budget
A capstone is a small engineering project with a fixed end date, a limited budget, a part-time team and stakeholders who expect to be kept informed. Managing it well does not require heavy software or ceremony, but it does require a schedule that shows what must happen when, a budget that shows where the money goes, a way of knowing whether the project is on track, and the discipline to act early when it is not. Émilie, as project manager, owned these. This lesson follows how she planned the TDX-150 project, how she tracked it, and what she did in week 18 when the numbers showed trouble.
The work breakdown structure
Planning starts with a work breakdown structure: the whole project divided into deliverable-oriented pieces, each small enough to estimate and assign. The TDX-150 WBS had ten top-level packages, from requirements to the final report, each broken into tasks of one to two weeks for one or two people. A good WBS describes outcomes, not activities: 'frame drawings released' rather than 'work on frame'. Every task has an owner, an estimate and a definition of done, so at any weekly meeting the question 'is it finished?' has a clear answer.
The WBS also connects to the capacity estimate of lesson 1. Each package's PERT estimate fed the total, and when the total exceeded capacity, the WBS made it clear which packages could move to Tidewater or to the stretch list.
The schedule and the critical path
With tasks, durations and dependencies, the schedule follows. The critical path method finds the longest chain of dependent tasks through the project; that chain sets the project's duration, and any delay on it delays the end. A forward pass computes each task's earliest start and finish from its predecessors; a backward pass from the end computes each task's latest start and finish. The difference is float, the time a task can slip without delaying the project. Tasks with zero float are critical.
# Capstone schedule (critical path) and earned value at week 18
tasks = {  # id: (description, weeks, predecessors)
    "A": ("brief, charter, requirements", 3, []),
    "B": ("concepts and selection", 3, ["A"]),
    "C": ("embodiment design and CAD", 4, ["B"]),
    "D": ("pump and frame analysis", 3, ["B"]),
    "E": ("critical design review", 1, ["C", "D"]),
    "F": ("long-lead purchases (priming kit, canopy)", 5, ["E"]),
    "G": ("frame fabrication at Tidewater", 3, ["E"]),
    "H": ("assembly and commissioning", 2, ["F", "G"]),
    "I": ("testing on TL-3 and the priming tank", 3, ["H"]),
    "J": ("final report and presentation", 2, ["I"]),
}
ES, EF = {}, {}
for k in tasks:                                  # listed in a valid order
    d, w, p = tasks[k]
    ES[k] = max((EF[x] for x in p), default=0); EF[k] = ES[k] + w
end = max(EF.values())
LF, LS = {}, {}
for k in reversed(list(tasks)):
    succ = [s for s in tasks if k in tasks[s][2]]
    LF[k] = min((LS[s] for s in succ), default=end); LS[k] = LF[k] - tasks[k][1]
print(f"Project length {end} weeks")
for k, (d, w, p) in tasks.items():
    fl = LS[k] - ES[k]
    print(f"  {k} {d:42s} weeks {ES[k]:2d}-{EF[k]:2d}  float {fl}{'  critical' if fl == 0 else ''}")

# Earned value at the end of week 18 (budget in local currency: hardware the team buys)
BAC = 14200.0
PV, EV, AC = 9600.0, 8300.0, 9900.0
CPI, SPI = EV / AC, EV / PV
EAC = BAC / CPI
print(f"CPI {CPI:.2f}, SPI {SPI:.2f}, EAC {EAC:,.0f} against BAC {BAC:,.0f} (variance at completion {BAC - EAC:,.0f})")
TCPI = (BAC - EV) / (BAC - AC)
print(f"To finish on budget the remaining work must run at CPI {TCPI:.2f}")Project length 23 weeks A brief, charter, requirements weeks 0- 3 float 0 critical B concepts and selection weeks 3- 6 float 0 critical C embodiment design and CAD weeks 6-10 float 0 critical D pump and frame analysis weeks 6- 9 float 1 E critical design review weeks 10-11 float 0 critical F long-lead purchases (priming kit, canopy) weeks 11-16 float 0 critical G frame fabrication at Tidewater weeks 11-14 float 2 H assembly and commissioning weeks 16-18 float 0 critical I testing on TL-3 and the priming tank weeks 18-21 float 0 critical J final report and presentation weeks 21-23 float 0 critical CPI 0.84, SPI 0.86, EAC 16,937 against BAC 14,200 (variance at completion -2,737) To finish on budget the remaining work must run at CPI 1.37
The program finds a 23-week project. The critical path runs through requirements, concepts, embodiment, the critical design review, the long-lead purchases, assembly, testing and the report. Analysis has one week of float, because it runs in parallel with embodiment and is shorter. Frame fabrication at Tidewater has two weeks of float, because it runs in parallel with the five-week wait for the priming kit and canopy parts. The 26-week year leaves three weeks of buffer after the planned end, which Émilie kept visible as a block at the end of the Gantt chart rather than hiding it inside task estimates.
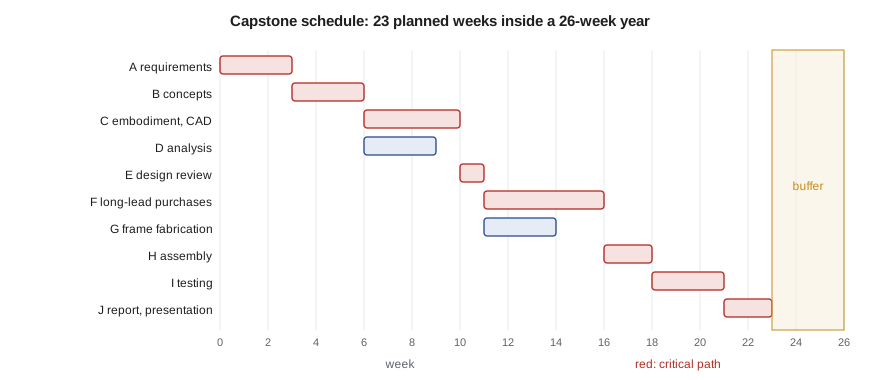
Visible buffer is a deliberate choice. If every task carries a hidden margin, people tend to use it, a pattern sometimes called student syndrome: work starts late because there seems to be time, and the margin is gone before the problem appears. A single shared buffer at the end, which the team draws on only when the critical path slips, is more honest and easier to track. Émilie reported buffer consumption at every weekly meeting: 'we have used one of our three weeks'.
The critical path also told the team where to focus. The long-lead purchases, five weeks for the vacuum priming kit and the laser-cut canopy panels, were the biggest single item on it, and nothing the team did could shorten a supplier's lead time. What they could do was start the clock early: Hannah released the purchase specification for the priming kit two days after the critical design review, and Émilie phoned the supplier every week.
The budget
Tidewater supplied the engine, pump wet end and frame fabrication from its own stock and shop. The team's own budget, 14,200 US dollars from the sponsor and the department's capstone fund, covered everything else: the priming kit, the canopy panels and lining, the fuel tank, the control panel, hoses and fittings, test consumables, and a 10 percent contingency. Émilie built the budget from quotations rather than catalog prices, because shipping, taxes and minimum order quantities routinely add 15 to 30 percent to small orders.
| Item | Budget | Basis |
|---|---|---|
| Vacuum priming kit (pump, separator, valves) | 3,900 | two quotations |
| Canopy panels, cutting and forming, lining | 2,700 | quotation, batch of one |
| Aluminum fuel tank, baffled, pressure tested | 1,800 | quotation |
| Control panel, switches, interlock, wiring | 1,600 | parts list and catalog |
| Hoses, couplings, strainer | 1,300 | quotation |
| Test consumables, fuel, spheres, fittings | 600 | estimate |
| Paint, labels, fasteners | 500 | estimate |
| Contingency | 1,800 | about 10 percent plus a margin for exchange rates |
Earned value
A budget report that says '9,900 spent of 14,200' says nothing about whether the project is on track, because it does not say how much work that money bought. Earned value management combines schedule and cost into three numbers measured at a status date. Planned value (PV) is the budgeted cost of the work scheduled to be done by then. Earned value (EV) is the budgeted cost of the work actually done. Actual cost (AC) is what was really spent. From them come two indices:
A cost performance index below 1 means each unit of money is buying less work than planned; a schedule performance index below 1 means work is behind plan. The estimate at completion, EAC, projects the final cost if the current cost efficiency continues, from the budget at completion, BAC.
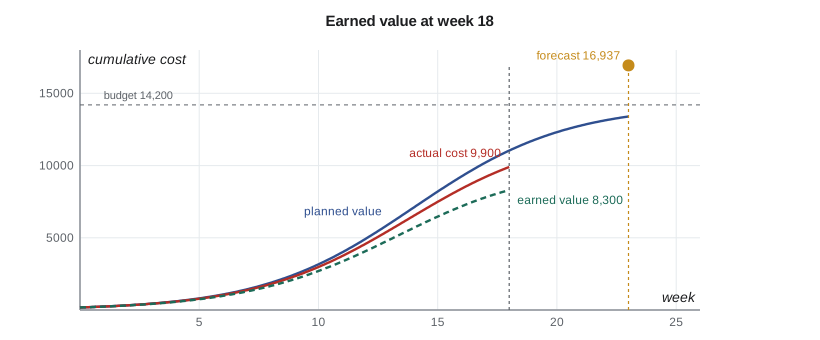
At the end of week 18, the numbers were PV 9,600, EV 8,300 and AC 9,900. The CPI was 0.84 and the SPI 0.86. The project was both behind schedule and over cost, and if nothing changed it would finish at about 16,900, some 2,700 over budget. To finish on budget, the remaining work would have to be done at a CPI of 1.37, far better than the team had achieved so far. That is not a realistic plan; it is a warning.
The causes were specific. The priming kit's shipping and import fees added about 700 that the quotation had not included. The first canopy panels were cut from a drawing revision that had not been released, a configuration error, and had to be re-cut at a cost of about 600; Hannah's response was to add a release check to the purchasing step. And testing had started late because assembly took two weeks instead of one, partly because the interlock switch arrived with the wrong connector.
Émilie did not wait for the end of the year. Within a week she presented three options to Owen and Professor Leger: draw on the contingency, which still had 1,100 left; drop the stretch-list prototype canopy lining in favor of a simpler foam lining; and ask Tidewater whether its test group could absorb the cost of test fuel and consumables. All three were agreed. The revised forecast came back within 300 of the budget, and the schedule recovered one week by running the noise and set-up tests in parallel.
Worked problem
Reading an earned value report
At week 12 a project has BAC 20,000, PV 8,000, EV 9,000 and AC 10,000. Interpret it.
Show solution
- SPI = 9,000/8,000 = 1.13: ahead of schedule.
- CPI = 9,000/10,000 = 0.90: over cost for the work done.
- EAC = 20,000/0.90 = 22,200: about 2,200 over budget at completion if efficiency holds.
- The project is doing work faster than planned but paying more for it; the manager should find why, for example overtime or expedited shipping.
Answer: Ahead of schedule, over cost; forecast 22,200 against 20,000.
Communication and change control
A project manager's most important tool is communication. Émilie sent a one-page status report to Dale, Owen and Professor Leger every two weeks: progress against the schedule, earned value, the top three risks, decisions needed and what was coming next. Bad news went in the report the week it was known, not saved for a review. Dale later said that the report in week 18, which told him plainly that the project was over budget and how the team would recover, gave him more confidence in the team than any of the good-news reports.
Changes to requirements, budget or schedule went through a simple change control: a written request stating what would change, why, and the effect on cost, schedule and other requirements, approved by the people the charter named. Two changes were approved during the project: adding the carbon monoxide alarm accessory after the FMEA, and moving the noise retest outside the course after the test failure. One was refused: a request from a cooperative board member to add remote monitoring, which the team's 'not required' list had already excluded.
Tools
The team used a shared spreadsheet for the WBS, schedule, budget and earned value, a shared drive with controlled folders for released drawings, and a task board with cards for the current sprint. Professional tools for scheduling, product data management and cost control do the same things at larger scale. The habits matter more than the software: one source of truth for each kind of information, a status date for every report, and numbers that are honest even when they are unwelcome.
Common mistakes
MistakeHiding margin inside every task estimate.
InsteadKeep a visible project buffer at the end of the critical path and report how much has been used.
MistakeReporting money spent without the work it bought.
InsteadUse earned value: compare EV with PV and AC to see both schedule and cost performance.
MistakeUsing catalog prices for small orders.
InsteadBudget from quotations including shipping, taxes and minimums, and hold contingency.
MistakeSaving bad news for the next review.
InsteadReport problems the week they are known, with options for recovery.
MistakeAccepting changes informally.
InsteadUse written change requests with their effect on cost, schedule and requirements, approved by the named people.
Summary and key terms
- A deliverable-oriented work breakdown structure gives every task an owner, estimate and definition of done.
- The critical path ran through requirements, concepts, embodiment, review, long-lead purchases, assembly, testing and report, for 23 weeks with 3 weeks of visible buffer.
- The prototype budget of 14,200 US dollars was built from quotations with contingency.
- At week 18, CPI 0.84 and SPI 0.86 forecast a final cost of about 16,900; a CPI of 1.37 would have been needed to finish on budget.
- Early action using contingency, scope changes and sponsor support brought the forecast back near budget.
- Regular honest status reports and written change control kept stakeholders informed and scope controlled.
- Work breakdown structure
- A hierarchical division of a project into deliverable-oriented pieces.
- Critical path
- The longest chain of dependent tasks, which sets the project duration.
- Float
- The time a task can slip without delaying the project end.
- Project buffer
- A shared, visible time reserve at the end of the critical path.
- Planned value
- The budgeted cost of work scheduled to be done by the status date.
- Earned value
- The budgeted cost of work actually done by the status date.
- Actual cost
- The cost actually incurred by the status date.
- Cost performance index
- Earned value divided by actual cost.
- Estimate at completion
- The forecast final cost, often budget divided by CPI.
- Change control
- A process for requesting, assessing and approving changes to scope, cost or schedule.
Practice problems
Work each problem on paper first, then reveal the answer to check.
Tasks A (3 weeks) and B (4 weeks) both follow the start; C (2 weeks) follows both. What is the project length and which task has float?
Show answer
6 weeks; A has 1 week of float.
PV 5,000, EV 4,500, AC 5,400. Find CPI and SPI.
Show answer
CPI 0.83, SPI 0.90.
BAC 12,000 and CPI 0.80. Find the EAC.
Show answer
15,000.
BAC 12,000, EV 6,000, AC 7,000. What CPI is needed on the remaining work to finish on budget?
Show answer
(12,000 − 6,000)/(12,000 − 7,000) = 1.20.
Why is a shared buffer better than margin inside each task?
Show answer
Hidden margins tend to be used up by late starts; a visible buffer is consumed only by real slips and can be tracked.
Lesson quiz · 5 questions
Score 60% or more to complete this lesson.
Create a free account to save your progress, take quizzes and earn a certificate.