
MEC-450 · Lesson 12 of 12 · 21 min
Verification, validation and the baseplate capstone
Owen's analyzes of the heavier-duty TP-80 are nearly complete: the shaft shoulder and relief groove, the casing cover under test pressure, the motor bracket, the adapter's heat flow, and the baseplate's stresses and natural frequencies. Before the design is released, Farah will review and seal the work, and the customer's engineers will read the report. Both will ask the same question in different words: why should anyone believe these numbers? This final lesson gathers the checks of the previous eleven into the formal framework that engineering practice uses to answer it, verification and validation, and follows Owen through the capstone: the baseplate study, from model plan to a validated, documented result.
Verification and validation
The two words are often used together, but they answer different questions. Verification asks whether the equations are being solved correctly: is the software free of errors that matter, and is the mesh fine enough for the answer? Validation asks whether the right equations are being solved: does the model, with its idealizations of geometry, material, loads and supports, represent the physical pump well enough for its intended use? A model can be perfectly verified and still invalid, for example by solving a linear elastic problem exactly when the real joint slips. A model can also agree with a test by accident while being badly verified, with a coarse mesh error canceling a wrong support. Credibility needs both.
The standard reference in North American mechanical engineering is ASME V&V 10, the guide to verification and validation in computational solid mechanics, first issued in 2006, revised in 2019 and reaffirmed since, together with its companion V&V 10.1 on validation metrics. NAFEMS, the international association for the engineering modeling and simulation community, publishes benchmark problems and guidance on simulation quality that are widely used to test software. Neither is a regulation, but both describe what reviewers, courts and clients increasingly expect of an analysis that supports a safety-related or costly decision.
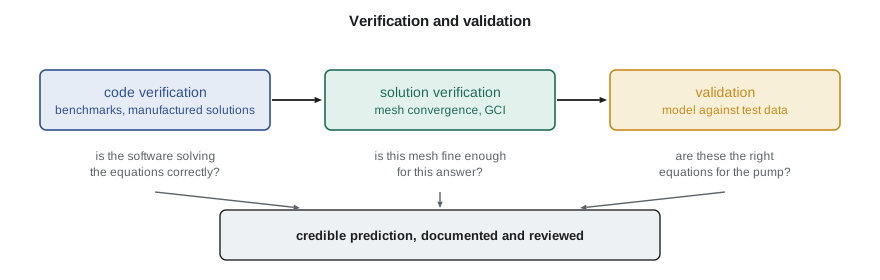
Code verification
Code verification tests the software against problems with known answers. Lessons 1 to 4 did this for Owen's small programs: every spring, bar, truss and beam model reproduced a hand calculation exactly. For commercial software the developer carries most of this responsibility, but the user must still confirm that the elements and options chosen behave as expected, because a package contains many element types and settings, not all suitable for every problem. Two methods are standard. Benchmarks are problems with accurate published solutions. NAFEMS's linear elastic benchmark LE1, an elliptical membrane under outward pressure, has a target tangential stress of 92.7 MPa at a specified point on the inner boundary, and is a common first test of plane stress elements. Manufactured solutions, a method associated with Patrick Roache, invent an exact solution, substitute it into the governing equation to find the load that would produce it, run the code with that load and check that the error falls at the theoretical rate as the mesh is refined.
# Verification and validation for the TP-80 baseplate study
import math
# 1. Code verification: NAFEMS LE1 (elliptic membrane), target tangential stress 92.7 MPa at point D
target = 92.7
runs = [("linear quadrilaterals, coarse", 63.9), ("linear quadrilaterals, fine", 85.4),
        ("quadratic quadrilaterals, coarse", 87.4), ("quadratic quadrilaterals, fine", 92.3)]
print("NAFEMS LE1 benchmark, stress at point D (target 92.7 MPa):")
for name, v in runs:
    print(f"  {name:34s} {v:6.1f} MPa   error {100*(v - target)/target:+6.1f} %")
# 2. Solution verification: observed order of a 1D Galerkin code against a manufactured solution u = x^2 (1 - x)
#    -u'' = 6x - 2 with u(0) = u(1) = 0; linear elements, L2 error of the derivative (energy norm) at four meshes
def run(ne):
    h = 1 / ne; n = ne - 1; g = [(-math.sqrt(0.6), 5/9), (0.0, 8/9), (math.sqrt(0.6), 5/9)]
    F = [0.0] * (ne + 1)
    for e in range(ne):
        for xi, w in g:
            x = (e + (xi + 1) / 2) * h; q = 6 * x - 2
            F[e] += w * h / 2 * q * (1 - xi) / 2; F[e + 1] += w * h / 2 * q * (1 + xi) / 2
    d = [2 / h] * n; o = -1 / h; b = F[1:-1]; c = [o] * (n - 1)
    for i in range(1, n):
        m = o / d[i - 1]; d[i] -= m * c[i - 1]; b[i] -= m * b[i - 1]
    u = [0.0] * n; u[-1] = b[-1] / d[-1]
    for i in range(n - 2, -1, -1): u[i] = (b[i] - c[i] * u[i + 1]) / d[i]
    U = [0.0] + u + [0.0]; err = 0.0
    for e in range(ne):
        s = (U[e + 1] - U[e]) / h
        for xi, w in g:
            x = (e + (xi + 1) / 2) * h; err += w * h / 2 * (s - (2 * x - 3 * x * x))**2
    return math.sqrt(err)
es = [run(n) for n in (4, 8, 16, 32)]
print("\nManufactured solution, energy-norm error: " + ", ".join(f"{e:.3e}" for e in es))
print("Observed orders: " + ", ".join(f"{math.log(es[i]/es[i+1])/math.log(2):.3f}" for i in range(3)) + " (expected 1 for linear elements)")
# 3. Validation: predicted against measured strain at four gauges on the baseplate during the TL-3 test
gauges = [("SG1 rail web, pump end", 118.0, 124.0), ("SG2 rail web, motor end", 96.0, 91.0),
          ("SG3 cross member", 42.0, 50.0), ("SG4 pump foot pad", 205.0, 214.0)]
u_exp = 6.0                                                  # microstrain, standard uncertainty of each gauge reading
print("\nGauge                        predicted  measured  difference   difference/u")
rel = []
for name, pred, meas in gauges:
    dlt = pred - meas; rel.append(dlt / meas)
    print(f"  {name:26s} {pred:7.0f}   {meas:7.0f}    {dlt:+6.0f}        {dlt/u_exp:+5.2f}")
rms = math.sqrt(sum(r * r for r in rel) / len(rel))
print(f"RMS relative difference {100*rms:.1f} percent; the largest is {100*max(abs(r) for r in rel):.1f} percent (SG3, a low-strain gauge)")NAFEMS LE1 benchmark, stress at point D (target 92.7 MPa): linear quadrilaterals, coarse 63.9 MPa error -31.1 % linear quadrilaterals, fine 85.4 MPa error -7.9 % quadratic quadrilaterals, coarse 87.4 MPa error -5.7 % quadratic quadrilaterals, fine 92.3 MPa error -0.4 % Manufactured solution, energy-norm error: 1.416e-01, 7.183e-02, 3.604e-02, 1.804e-02 Observed orders: 0.979, 0.995, 0.999 (expected 1 for linear elements) Gauge predicted measured difference difference/u SG1 rail web, pump end 118 124 -6 -1.00 SG2 rail web, motor end 96 91 +5 +0.83 SG3 cross member 42 50 -8 -1.33 SG4 pump foot pad 205 214 -9 -1.50 RMS relative difference 9.0 percent; the largest is 16.0 percent (SG3, a low-strain gauge)
Owen's runs of LE1 with the package's elements show how much the element choice matters. Linear quadrilaterals on the coarse benchmark mesh are 31 percent low, and still 8 percent low on the fine mesh; quadratic quadrilaterals are within 6 percent on the coarse mesh and within half a percent on the fine one. That confirms the element choice Farah's group uses and quantifies how far a coarse linear model can be from the truth at a stress concentration. The manufactured solution test of the one-dimensional Galerkin code gives observed orders of 0.979, 0.995 and 0.999, approaching the theoretical 1 for the energy-norm error of linear elements. A code with a bug in its load integration or assembly would show an order that stalls or drifts, even if its answers looked reasonable.
Solution verification
Solution verification asks how large the discretization error is in this particular model. Lesson 8's procedure, at least three meshes, an observed order, Richardson extrapolation and the grid convergence index, is the standard method, applied at every location where a result is reported. For the baseplate, Owen ran three shell meshes and found the peak stress at the pump foot pad converging with a GCI of 1.1 percent. Iterative and round-off errors are also part of solution verification: for a linear static problem with a direct solver they are negligible, but for contact, nonlinear material or iterative solvers, the convergence tolerances must be checked, for example by tightening them and confirming that the results do not change.
Validation against the TL-3 test
The first heavier-duty baseplate is assembled with its pump and motor on TL-3, the test stand Owen instrumented in the measurements course. Gilles Thériault bonds four strain gauges at locations the model identified as important: the rail webs at the pump and motor ends, the cross member and the pump foot pad. With the pump running at its guarantee point, the gauges read the strains caused by the nozzle loads and the operating torque, which the model also predicts. The measured strains have a standard uncertainty of about 6 microstrain each, from gauge factor, alignment and signal noise, evaluated as in the uncertainty lesson of that course.
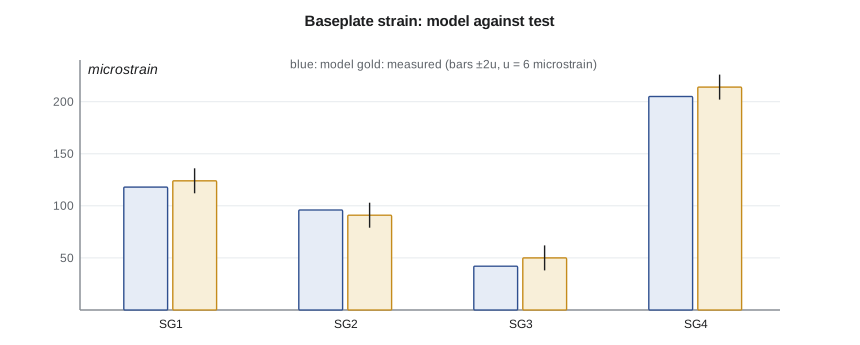
The program compares them. The differences are −6, +5, −8 and −9 microstrain, between 0.8 and 1.5 standard uncertainties of the measurement, and the root-mean-square relative difference is 9.0 percent. The largest relative difference, 16 percent, is at the cross member, a low-strain location where a few microstrain is a large fraction. The model is slightly too stiff overall, as Lesson 5 predicts for displacement-based models and Lesson 11's bump test also suggested. For the intended use, a fatigue check of the pump foot pad region with a safety factor above 2, agreement of this order is adequate, and Owen records that judgment and the reasons for it.
Validation is always for an intended use. The same model would need closer agreement, or a larger margin, if it were used to predict a natural frequency within 5 percent of running speed, or the lifetime of a weld with little reserve. ASME V&V 10 calls for the required accuracy to be set before the test, so the comparison cannot be tuned afterward; Owen and Farah agreed on a 15 percent root-mean-square criterion for the high-strain gauges before Gilles bonded them.
Professional responsibility
In the United States, Farah will seal the baseplate report as a licensed professional engineer (PE), under the oversight of the Maine State Board of Licensure for Professional Engineers. Engineering regulators expect a licensed engineer who relies on software to understand its theory and limitations, to verify that it was used correctly for the problem, and to keep records sufficient for another engineer to check the work. Professional Engineers Ontario's guideline on professional engineers using software-based engineering tools sets out such expectations in detail, and other regulators publish similar guidance or apply the same principles through their codes of ethics and practice standards. The sealing engineer cannot delegate responsibility to the software vendor, the junior engineer or the checking program. This is why Farah reviewed Owen's model plan before he built it and why every result in his report is paired with its check.
The capstone report
Owen's report on the heavier-duty TP-80 follows a structure Farah's group uses for every analysis. It states the question and the acceptance criteria; describes the geometry, material properties and their sources; justifies the idealization, including symmetry, element types and how bolts, welds and isolators are represented; lists the loads and load combinations; presents the verification, with benchmark results, convergence studies and GCIs at reported locations; presents the validation, with the test comparison and its uncertainty; gives the results with their margins; and lists the limitations and the assumptions that would change the conclusions if they proved wrong. The results section is the shortest.
The conclusions are concrete. The baseplate's peak stress at the pump foot pad is well within the fatigue limit of the welded detail, and its first natural frequency, corrected for the measured isolator stiffness, is 42.5 Hz against a running speed of 29.3 Hz, a 45 percent margin above the 15 to 20 percent separation the group requires. The casing cover's joint stays closed at the test pressure, with deflection inside the plate-theory bounds. The relief groove's stress concentration is found from a converged three-mesh study. The adapter carries about 40 W to the bearing frame. Each number in the summary is traceable to a model, a check and, where possible, a measurement.
Worked problem
Deciding whether validation is adequate
Suppose the model had predicted 165 microstrain at the pump foot pad where 214 was measured, 23 percent low, while the other gauges agreed within 6 percent. What should Owen do?
Show solution
- The agreed criterion was 15 percent for high-strain gauges, so the foot pad fails validation.
- Since the other gauges agree, a global error such as units or the overall load is unlikely; the problem is local.
- Candidates: the pad's weld or stiffener modeled differently from the as-built part, a shell junction read too close to the weld, or the gauge itself misplaced.
- Owen inspects the as-built pad, checks the gauge position against the drawing, and refines or corrects the local model before using it for the fatigue check.
Answer: He does not adjust the model's parameters until it matches; he finds the physical reason for the difference, corrects the model, and records both the discrepancy and the correction.
Common mistakes
MistakeTreating agreement with one test as proof that a model is right.
InsteadVerify the code and the mesh as well; agreement can come from canceling errors.
MistakeSetting the validation criterion after seeing the test results.
InsteadAgree on the required accuracy for the intended use before testing.
MistakeTuning model parameters until the test matches.
InsteadFind the physical cause of a discrepancy, correct the model and document both.
MistakeUsing linear elements at a stress concentration because the software accepts them.
InsteadBenchmark the element choice; LE1 shows linear elements far from the target on coarse meshes.
MistakeLeaving the checks out of the report.
InsteadReport verification and validation alongside results, so a reviewer can follow every number.
Summary and key terms
- Verification asks whether the equations are solved correctly; validation asks whether they are the right equations for the intended use.
- ASME V&V 10 and NAFEMS benchmarks such as LE1 (target 92.7 MPa) are standard references for solid mechanics.
- LE1 runs show linear quadrilaterals 31 and 8 percent low, quadratic ones 6 and 0.4 percent low.
- A manufactured-solution test confirms the expected order of accuracy, 0.979 to 0.999 against 1.
- The baseplate model agrees with four strain gauges within 9 percent root mean square, adequate for its fatigue check.
- The sealing engineer remains responsible for software results; reports pair each result with its verification and validation.
- Verification
- Confirming that a model's equations are solved correctly, by code and solution checks.
- Validation
- Confirming that a model represents the physical system adequately for its intended use.
- Code verification
- Testing software against problems with known answers.
- Solution verification
- Estimating the numerical error, chiefly discretization error, of a specific model.
- Benchmark
- A published problem with an accurate reference solution for testing software.
- Method of manufactured solutions
- Verifying a code by inventing an exact solution and checking the observed order of accuracy.
- Validation metric
- A quantitative measure of agreement between model predictions and test data.
- Intended use
- The specific purpose for which a model's accuracy is judged.
- Model plan
- A written statement of the analysis question, idealization, loads and checks agreed before modeling.
- Traceability
- The ability to follow each reported result back to its model, inputs and checks.
Practice problems
Work each problem on paper first, then reveal the answer to check.
A model of a beam gives exactly the closed-form deflection. Is the model validated?
Show answer
No: that is verification; validation needs comparison with the physical part.
An LE1 run gives 88.1 MPa. What is its error?
Show answer
(88.1 − 92.7)/92.7 = −5.0 percent.
From the program, what is the difference at SG4 in units of the measurement's standard uncertainty?
Show answer
−1.50.
Why might a converged finite element model still disagree with a test by 10 percent?
Show answer
Idealization error: joints, supports, material properties or loads differ from the real system.
Name three items a reviewer should be able to find in an analysis report besides the results.
Show answer
The idealization and its justification, the convergence study with GCIs, and the validation comparison with its uncertainty.
Lesson quiz · 5 questions
Score 60% or more to complete this lesson.
Create a free account to save your progress, take quizzes and earn a certificate.