
MEC-440 · Lesson 6 of 12 · 21 min
Wind energy
Wind has become one of the largest sources of new electricity in North America, and the prairies and upper Midwest have some of the best wind resources on the continent. Minnesota was an early wind state; wind now supplies roughly a quarter of its generation, and more is planned to meet the 2040 standard. Kofi has been approached by a developer who proposes that Northgate sign a long-term power purchase agreement for the output of a share of a new wind farm, to match the electricity its future heat pumps will use. Before the team can judge the offer, it needs to understand how much energy a wind turbine really produces and what limits it.
The power in the wind
Air of density \(\rho\) moving at speed \(v\) through an area \(A\) carries kinetic energy at the rate
The cube of the speed is the most important fact in wind energy. Doubling the wind speed multiplies the available power by eight. A site with an average speed 10 percent higher has roughly a third more power in the wind. Density matters too: cold, dense prairie air in January carries about 15 percent more power than warm summer air at the same speed.
A turbine cannot extract all of this power, because the air must keep moving to leave the rotor. Momentum theory for an ideal rotor shows that the maximum fraction that can be extracted, the Betz limit, is 16/27, or 59.3 percent, reached when the rotor slows the wind to one third of its upstream speed in the far wake. The ratio of the power extracted to the power in the wind is the power coefficient \(C_p\). Modern three-bladed turbines reach a \(C_p\) of about 0.45 to 0.50 at their best operating point, and the whole drivetrain, including gearbox, generator and converter, loses a few percent more.
The power curve
A turbine's power curve shows its electrical output against wind speed at hub height. Below the cut-in speed, about 3 m/s, it does not run. Between cut-in and the rated speed, about 10 to 12 m/s, output rises roughly with the cube of speed as the control system adjusts rotor speed to keep \(C_p\) near its maximum. Above rated speed the blades are pitched to shed power and hold output at the generator's rating. At the cut-out speed, typically 25 m/s, the turbine shuts down to protect itself, although many modern machines ramp output down gradually rather than stopping abruptly.
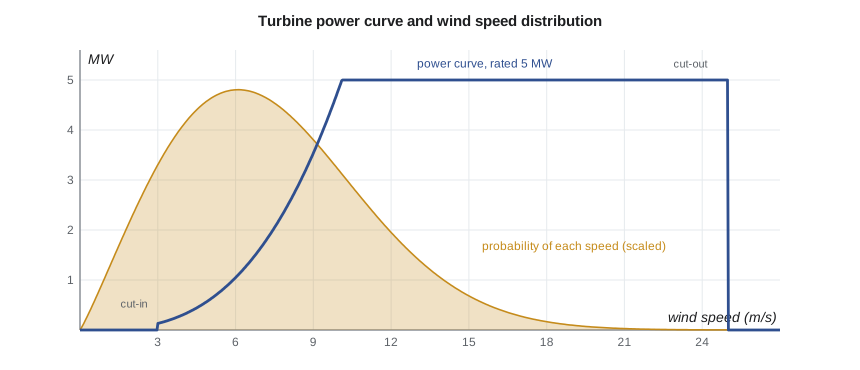
Turbines have grown steadily. Land-based machines installed in North America now commonly have rotors of 130 to 170 m diameter on towers over 100 m tall, rated at 3 to 6 MW. Larger rotors on the same generator lower the rated speed and raise the capacity factor, because the turbine reaches full output more often. Taller towers reach faster, steadier wind, because wind speed increases with height above the ground, roughly with a power law of exponent about 0.14 to 0.25 depending on terrain and stability.
Wind speed distribution and annual energy
Wind speed varies continuously. Over a year the distribution of hourly mean speeds at a site is usually well described by a Weibull distribution with a shape factor \(k\) of about 2 and a scale factor \(c\) a little above the mean speed.
The annual energy is the power curve weighted by the distribution and multiplied by 8,760 hours. In practice developers measure wind with met masts and remote-sensing lidar for at least a year, correlate the measurements with long-term reference data, and calculate energy with the manufacturer's power curve for the site's air density. They then subtract losses: wake losses from turbines shading each other, typically 5 to 12 percent on a large farm, availability losses for maintenance and faults, electrical losses, blade icing and curtailment when the grid cannot take the power.
# Wind energy: Betz limit, a turbine power curve and annual energy from a Weibull wind speed distribution
SITE = 'us'
import math
rho = 1.22                         # air density, kg/m3 (cold prairie air is denser than this in winter)
D = 150.0; A = math.pi*D**2/4      # rotor diameter, m
P_rated = 5.0e6                    # W
def curve(v):
    if v < 3.0 or v > 25.0: return 0.0
    p = 0.5*rho*A*0.45*v**3        # power coefficient 0.45 below rated
    return min(p, P_rated)
v_r = (P_rated/(0.5*rho*A*0.45))**(1/3)
print(f"Rotor {D:.0f} m, swept area {A:,.0f} m2; rated {P_rated/1e6:.0f} MW reached at about {v_r:.1f} m/s")
print(f"Betz limit 16/27 = {16/27:.3f}; this turbine's Cp below rated: 0.45")
# Weibull distribution at hub height: shape k, scale c
k, c = {'ca': (2.1, 8.3), 'us': (2.2, 8.6)}[SITE]
vmean = c*math.gamma(1 + 1/k)
dv = 0.1; E = 0.0
for i in range(int(30/dv)):
    v = (i + 0.5)*dv
    f = (k/c)*(v/c)**(k - 1)*math.exp(-(v/c)**k)
    E += curve(v)*f*dv
E_yr = E*8760/1e9          # GWh gross
loss = 0.12                # wakes, availability, icing, curtailment, electrical
print(f"Weibull k {k}, c {c} m/s -> mean speed {vmean:.2f} m/s")
print(f"Gross annual energy {E_yr:.1f} GWh; net after {loss*100:.0f} % losses {E_yr*(1-loss):.1f} GWh")
print(f"Net capacity factor {E_yr*(1-loss)*1000/(P_rated/1e6*8760):.2f}")
# Cube law: what a 10 % change in mean speed does
for f in (0.9, 1.1):
    c2 = c*f; E2 = 0.0
    for i in range(int(30/dv)):
        v = (i + 0.5)*dv; ff = (k/c2)*(v/c2)**(k - 1)*math.exp(-(v/c2)**k); E2 += curve(v)*ff*dv
    print(f"  mean speed x {f:.1f}: energy x {E2/E:.2f}")
# Turbines needed for Northgate's planned heat pump electricity (80 GWh/yr)
print(f"Turbines to supply 80 GWh/yr on an annual basis: {80/(E_yr*(1-loss)):.1f}")Rotor 150 m, swept area 17,671 m2; rated 5 MW reached at about 10.1 m/s Betz limit 16/27 = 0.593; this turbine's Cp below rated: 0.45 Weibull k 2.2, c 8.6 m/s -> mean speed 7.62 m/s Gross annual energy 20.7 GWh; net after 12 % losses 18.2 GWh Net capacity factor 0.42 mean speed x 0.9: energy x 0.84 mean speed x 1.1: energy x 1.14 Turbines to supply 80 GWh/yr on an annual basis: 4.4
Two results deserve attention. The capacity factor of about 0.4 is typical of good modern sites on the plains. And a 10 percent increase in mean wind speed raises energy by only about 14 percent, not 33 percent, because the turbine spends more of its time at rated output, where extra wind speed adds nothing. The cube law describes the wind; the power curve describes the machine.
Variability and the grid
Wind output varies from minute to minute with gusts, from hour to hour with weather systems, and from season to season. Over a large region, the output of many farms is smoother than that of one, but calm periods lasting several days still occur, often during the high-pressure systems that bring the coldest winter weather. For Northgate this matters directly: a wind farm that produces, on average, the electricity its heat pumps use will produce much less than that during some of the coldest, stillest weeks of the year, when heat demand is highest.
An annual power purchase agreement for wind is therefore an accounting match, not a physical one. In the hours when the wind farm produces more than Northgate uses, the surplus goes into the grid; when it produces less, Northgate draws on the grid. Whether that deal actually reduces emissions depends on whether the wind farm is additional, built because of the contract, and on what grid plants the wind displaces in each hour. A stronger approach, now adopted by some large buyers, is to match consumption with clean supply hour by hour, which requires storage, flexible demand or a mix of sources.
The grid also has limits on how much variable output it can absorb. Transmission must carry wind power from windy rural areas to cities; system operators need reserves and flexible plant to balance it; and in some hours wind farms are curtailed because there is nowhere for the power to go. Minnesota's grid is part of a large regional market whose operator balances wind across many states, and transmission expansion is one of the main constraints on further growth.
Capacity credit
System planners need to know how much a wind farm contributes to meeting the peak, not just how much energy it produces. The measure is its capacity credit, often estimated as its effective load-carrying capability: the amount of firm, always-available capacity that would give the system the same reliability as the wind farm. Because the coldest winter peaks often coincide with calm weather, the capacity credit of wind on a winter-peaking northern grid can be well below its capacity factor, sometimes 10 to 20 percent of its rating, and it falls as more wind is added because the farms' outputs are correlated. A planning study that counts wind's nameplate capacity toward the peak will badly overstate the system's reliability; one that counts its capacity credit will see why firm capacity, storage and flexible demand remain necessary even on grids with a great deal of wind.
Other considerations
Wind farms need land, but the turbines occupy only a small part of it; farming continues between them. They affect birds and bats, especially at poorly sited farms on migration routes, and careful siting, curtailment at low wind speeds when bats are active, and new detection systems reduce the effect. Noise and the moving shadows of blades limit how close turbines can be to homes, and local acceptance is often the deciding factor in whether a farm is built. In cold climates, ice on the blades reduces output and can be thrown from rotating blades, so turbines have ice detection and sometimes blade heating, and setbacks from roads and buildings. At the end of a turbine's 20 to 30 year life most of it can be recycled, although composite blades remain a challenge.
Offshore wind, with larger turbines and steadier winds, is growing on the Atlantic coast and in Europe but is not relevant to the prairies. Small turbines on buildings in cities produce very little energy because the wind there is slow and turbulent, and they should not be part of a serious plan.
Worked problem
A share of a wind farm for the heat pumps
Northgate's river heat pumps would use about 80 GWh of electricity a year. The developer offers a share of a new farm of 5 MW turbines with a net capacity factor of 0.42. How many turbines' worth of output would match the annual consumption, and how much would be supplied in a calm week when the farm runs at a capacity factor of 0.05 while the heat pumps run at full load of 25 MW electric?
Show solution
- Energy per turbine: \(5 \times 8760 \times 0.42 = 18{,}400\) MWh.
- Turbines needed: \(80{,}000/18{,}400 = 4.3\), so about five turbines, 25 MW.
- Calm week: \(25 \times 0.05 \times 168 = 210\) MWh supplied against \(25 \times 168 = 4{,}200\) MWh used.
Answer: About five turbines would match the year, but in a calm week they would supply only about 5 percent of the heat pumps' electricity. The rest must come from the grid, from storage or from other plant, which is why the contract does not remove the need for firm capacity.
The team concludes that a wind contract is a reasonable way for Northgate to support new clean generation and to fix part of its electricity cost for twenty years, and on the Minnesota grid it brings forward the carbon benefit of electrification before the grid as a whole reaches the 2040 standard. The contract does not provide firm capacity, so the heat pumps still need the grid and storage in calm weather.
Common mistakes
MistakeUsing the cube law to scale annual energy with mean wind speed.
InsteadUse the turbine's power curve with the speed distribution; rated output caps the gain.
MistakeForgetting losses when estimating wind farm output.
InsteadSubtract wake, availability, electrical, icing and curtailment losses, often 10 to 20 percent in total.
MistakeTreating an annual power purchase agreement as physical supply in every hour.
InsteadCheck supply against demand hour by hour, especially in cold, calm weather.
MistakeIgnoring air density.
InsteadCorrect the power curve for site density; cold air raises output.
MistakePlanning small urban turbines as a serious energy source.
InsteadRecognize that slow, turbulent city wind yields very little energy.
Summary and key terms
- Wind power scales with the cube of speed, \(P = \tfrac12 \rho A C_p v^3\).
- No rotor can extract more than the Betz limit of 16/27 of the wind's power; real turbines reach \(C_p\) of 0.45 to 0.50.
- Power curves have cut-in, rated and cut-out speeds; output is capped at rated power.
- Annual energy combines the power curve with a Weibull speed distribution, minus 10 to 20 percent losses.
- Good plains sites reach capacity factors of about 0.35 to 0.45.
- Wind is variable; annual matching does not supply calm, cold weeks, so firm capacity and storage remain necessary.
- Betz limit
- The maximum fraction, 16/27, of the wind's kinetic power that an ideal rotor can extract.
- Power coefficient
- The ratio of power extracted by a turbine to the power in the wind through its rotor area.
- Power curve
- A turbine's electrical output against wind speed at hub height.
- Rated speed
- The wind speed at which a turbine reaches its rated output.
- Weibull distribution
- A two-parameter probability distribution commonly used for wind speeds.
- Wake loss
- Reduction in a wind farm's output because turbines operate in the slowed, turbulent air behind others.
- Curtailment
- Deliberate reduction of output because the grid cannot accept the power.
- Power purchase agreement
- A long-term contract to buy electricity, or its attributes, from a generator.
Practice problems
Work each problem on paper first, then reveal the answer to check.
Find the power in wind at 8 m/s through a 150 m rotor with air density 1.22 kg/m³.
Show answer
\(0.5 \times 1.22 \times 17{,}671 \times 512 = 5.52\) MW.
What is the extracted power at \(C_p = 0.45\) in the previous problem?
Show answer
About 2.5 MW.
A Weibull distribution has \(k = 2\) and \(c = 8.0\) m/s. What is the mean speed?
Show answer
\(8.0 \times \Gamma(1.5) = 8.0 \times 0.886 = 7.09\) m/s.
Wind speed at 10 m is 5 m/s. Estimate it at 120 m with a power-law exponent of 0.2.
Show answer
\(5(120/10)^{0.2} = 5 \times 1.64 = 8.2\) m/s.
Why does a larger rotor on the same generator raise the capacity factor?
Show answer
It reaches rated output at a lower wind speed, so it runs at full power more often.
Lesson quiz · 5 questions
Score 60% or more to complete this lesson.
Create a free account to save your progress, take quizzes and earn a certificate.