
MBA-514 · Lesson 11 of 12 · 20 min
Strategy execution: structure, culture and the balanced scorecard
Hana Kowalski's hospital network adopted a new strategy eighteen months ago, and by most measures nothing has changed. Lakeview Health's board approved a plan to shift care from its hospital to community clinics and virtual visits, to cut readmissions and to reduce emergency department waits. The plan was presented at town halls, printed on posters and summarized in a slide that every manager can recite. Yet the hospital's budget still rewards departments for volume, the clinics report to a different vice-president from the hospital wards they are meant to relieve, physicians are paid per visit regardless of setting, and the monthly management report tracks 140 measures, almost none of which concern the new strategy. Hana's question for the session is the one every manager eventually asks: why is it so hard to make a strategy happen?
Dr. Ashford's answer begins with a finding many executives recognize. Michael Mankins and Richard Steele, in a 2005 Harvard Business Review article based on a survey of large companies, estimated that companies on average delivered only about 63 percent of the financial value their strategic plans had promised, and that the causes lay mostly in execution: inadequate or unavailable resources, poorly communicated strategy, unclear actions and accountabilities, and organizational silos. Donald Sull, Rebecca Homkes and Charles Sull, in a 2015 article titled Why Strategy Execution Unravels and What to Do About It, found from surveys of managers that most could rely on their bosses and their own teams to deliver, but far fewer could rely on colleagues in other units. Coordination across the organization, they argued, is where execution most often breaks down.
Structure follows strategy
Alfred Chandler, in his 1962 book Strategy and Structure, studied the development of large American companies such as DuPont and General Motors and concluded that structure follows strategy: as firms diversified into new products and regions, their centralized, functional structures were overwhelmed, and they eventually adopted multidivisional structures with semi-autonomous divisions and a general office responsible for strategy and capital allocation. His broader point was that a new strategy that is not matched by a new structure will struggle.
Organizations choose among a few basic structures. A functional structure groups people by expertise, such as operations, marketing and finance; it supports efficiency and deep expertise but makes coordination across functions slow. A divisional structure groups people by product, customer or region, each division with its own functions; it supports responsiveness and accountability but duplicates resources and can create rivalry between divisions. A matrix structure combines two dimensions, such as product and region, with managers reporting to two bosses; it can balance competing demands but is hard to manage, with frequent conflicts over priorities. Network and team-based structures organize around projects or processes, sometimes across organizational boundaries. No structure is best in general; each makes some coordination easy and other coordination hard, and the right choice depends on which coordination the strategy most needs.
Jay Galbraith's star model, developed from the 1970s onward, places structure among five elements that must be aligned with strategy: structure, which determines where formal power lies; processes, which connect units across the structure; rewards, which align individual goals with the organization's; people practices, which build the skills the strategy needs; and strategy itself. A similar framework, the McKinsey 7-S model, described by Robert Waterman, Tom Peters and Julien Phillips in a 1980 article, adds shared values, style and staff to strategy, structure, systems and skills. Both make the same point: changing one element without the others produces conflicting signals, and people follow the signals of the systems they work in rather than the words of the strategy.
Culture
Edgar Schein, in his book Organizational Culture and Leadership, described culture at three levels: artifacts, the visible structures and behaviors of an organization; espoused values, what it says it believes; and basic underlying assumptions, the taken-for-granted beliefs that actually guide behavior. Strategies that conflict with underlying assumptions meet resistance even when they are endorsed at the level of espoused values. At Lakeview, the espoused values support community care, but the underlying assumption among many physicians and managers is that the hospital is the center of the system and that the best care is delivered in its wards.
Culture cannot be changed by announcement, but it can be shaped by what leaders pay attention to, how they react to crises, what they reward, whom they promote and how they allocate resources. Changes in behavior, encouraged by changes in systems and structures, tend to change beliefs over time rather than the other way around. The practical implication is that a strategy that requires a change in culture should begin by changing the systems that shape daily behavior, while leaders model the new priorities consistently.
The balanced scorecard
Robert Kaplan and David Norton introduced the balanced scorecard in a 1992 Harvard Business Review article as a response to the dominance of financial measures, which report the results of past actions but say little about what drives future performance. The scorecard measures performance from four perspectives: financial, how the organization looks to its owners; customer, how customers see it; internal process, what it must excel at; and learning and growth, how it can continue to improve and create value. A small number of measures in each perspective, linked to the strategy, replaces long lists of indicators.
In later work, including their 2004 book Strategy Maps, Kaplan and Norton emphasized the causal links among the perspectives. A strategy map shows how investments in people, systems and culture improve internal processes, which deliver the value proposition to customers, which produces financial results. Each objective on the map has measures, targets and initiatives. The map makes the strategy's logic explicit and testable: if the process measures improve but the customer measures do not, the strategy's hypothesis about what customers value may be wrong.
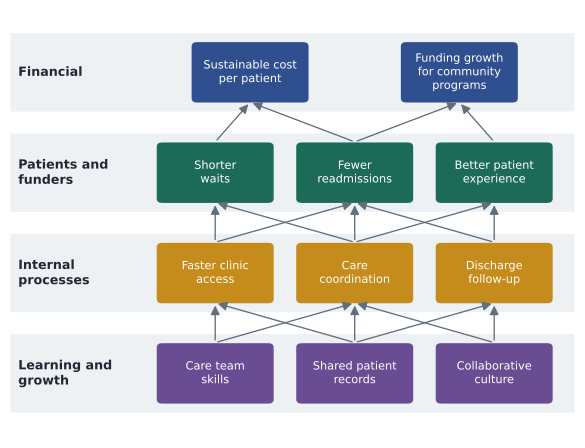
Hana's team replaces the 140-measure report with a scorecard of fourteen measures linked to the strategy map. In the learning and growth perspective, the share of clinic staff trained in chronic disease management and the share of patients with records shared between clinics and the hospital. In internal processes, the days to a clinic appointment after referral, the share of discharged patients contacted within 48 hours and the share of visits delivered virtually. In the patient perspective, 30-day readmission rates, emergency department waiting times and patient experience scores. In the financial perspective, cost per patient episode and funding secured for community programs.
# Lakeview Health's scorecard: weighted status against targets
measures = [  # perspective, measure, weight, baseline, current, target, higher_is_better
    ("learning", "clinic staff trained (share)",          0.08, 0.20, 0.45, 0.80, True),
    ("learning", "patients with shared records (share)",  0.08, 0.35, 0.52, 0.90, True),
    ("process",  "days to clinic appointment",            0.10, 21.0, 16.0, 7.0, False),
    ("process",  "discharges contacted in 48 h (share)",  0.10, 0.30, 0.61, 0.85, True),
    ("process",  "virtual share of visits",               0.08, 0.08, 0.17, 0.25, True),
    ("patient",  "30-day readmission rate",               0.16, 0.142, 0.131, 0.110, False),
    ("patient",  "emergency wait, median hours",          0.14, 4.6, 4.4, 3.0, False),
    ("patient",  "patient experience score",              0.10, 78, 80, 85, True),
    ("finance",  "cost per episode, thousands",           0.16, 6.8, 6.7, 6.2, False),
]
def progress(base, now, target):
    return max(0.0, min(1.0, (now - base) / (target - base)))
total = 0.0
by_perspective = {}
for persp, name, w, base, now, target, up in measures:
    p = progress(base, now, target)
    total += w * p
    by_perspective.setdefault(persp, []).append(p)
    status = "on track" if p >= 0.5 else ("behind" if p >= 0.25 else "at risk")
    print(f"{name:40s} progress {p:4.0%}  {status}")
print(f"Weighted progress toward targets: {total:.0%}")
for persp, ps in by_perspective.items():
print(f" {persp:9s} average progress {sum(ps) / len(ps):.0%}")clinic staff trained (share) progress 42% behind patients with shared records (share) progress 31% behind days to clinic appointment progress 36% behind discharges contacted in 48 h (share) progress 56% on track virtual share of visits progress 53% on track 30-day readmission rate progress 34% behind emergency wait, median hours progress 12% at risk patient experience score progress 29% behind cost per episode, thousands progress 17% at risk Weighted progress toward targets: 32% learning average progress 36% process average progress 48% patient average progress 25% finance average progress 17%
The output tells a story the old report concealed. Progress in learning and growth and in internal processes is real: training, shared records, follow-up calls after discharge and virtual visits have moved between a third and a half of the way to their targets, and two process measures are on track. But the patient and financial outcomes have moved much less, with an average of about a quarter of the way for the patient measures and less than a fifth for cost per episode. Emergency waits are almost unchanged, and readmissions have improved only modestly. The strategy map suggests two explanations. The process improvements may take time to show up in outcomes, or the hypothesis linking them may be weak. Hana's team investigates and finds that patients discharged from the hospital still wait sixteen days for a clinic appointment, so the follow-up calls identify problems that the clinics cannot address quickly. The bottleneck is clinic capacity, which leads the team to the structural issue that clinic and hospital budgets are managed separately.
Aligning resources, structures and incentives
The scorecard reveals problems; fixing them requires changes in the other elements of the star model. Hana's team proposes four changes. In structure, the clinics and the hospital's medical wards will report to a single vice-president for community and acute care, so that capacity can be shifted between them. In processes, a joint weekly huddle of hospital discharge planners and clinic managers will match discharges to appointment slots. In rewards, department budgets will be set partly on episode cost and readmissions rather than on volume, and physicians will receive the same payment for a virtual or clinic visit as for a hospital outpatient visit. In people, clinic staff will be trained to manage more complex patients. Each change addresses a signal in the current system that contradicts the strategy.
Objectives and key results, OKRs, are another widely used execution tool. Andy Grove introduced them at Intel in the 1970s, and John Doerr, who learned them there, popularized them in his 2018 book Measure What Matters. An objective is a qualitative statement of what the organization wants to achieve; key results are a few measurable outcomes, usually set quarterly, that show whether it has been achieved. OKRs work well for focusing teams on a small number of priorities and for aligning goals up and down the organization, but like any measurement system they can be gamed if they are tied too tightly to pay. Whatever tool an organization uses, measures should be few, linked to the strategy, owned by named people and reviewed regularly, with resource allocation following the results.
Execution at Cedarline
Cedarline's current organization is designed for its old strategy. Its merchandising team is rewarded for revenue and range breadth, which explains the 3,400 styles; its wholesale team is rewarded for volume with the chains, which explains the growing allowances; and its store operations, online and wholesale teams each control their own inventory, which explains part of the inventory build-up the cohort analyzed in MBA-501. The repair workshop, central to the durability position, reports to customer service and has no budget for growth. The capstone will need to address these misalignments as well as the strategic choices themselves.
Worked problem
Designing a scorecard for Kestrel
Leo Brandt wants a scorecard for Kestrel's strategy of becoming a learning system built on pooled data, as discussed in lessons 4 and 8. Propose two measures for each of the four perspectives and explain the causal links.
Show solution
- Learning and growth: share of employees trained in data governance; number of data-sharing agreements renegotiated to allow pooling.
- Internal process: share of new customers live within six weeks of signing; forecast accuracy improvement attributable to pooled data, measured by holdout tests.
- Customer: share of customers contributing data to the pool; net revenue retention, which captures renewals and expansion.
- Financial: annual recurring revenue growth; gross margin, which should rise as models improve without proportional increases in staff.
- Causal logic: governance skills and agreements expand the pool, faster onboarding and better accuracy raise retention and participation, and those drive revenue growth and margin.
Answer: The scorecard makes Leo's strategy testable: if participation rises but accuracy does not improve, the claim that pooled data creates an advantage needs re-examination.
Common mistakes
MistakeCommunicating the strategy is enough to execute it.
InsteadPeople follow the signals of structure, processes, rewards and budgets; these must be changed to match the strategy.
MistakeMore measures give better control.
InsteadLong lists hide the strategy; a few measures linked by a strategy map focus attention.
MistakeStructure can be chosen independently of strategy.
InsteadEach structure makes some coordination easy and other coordination hard; choose based on what the strategy needs.
MistakeCulture should be changed first, by persuasion.
InsteadCulture changes mostly through changed behavior encouraged by systems, rewards and leaders' consistent attention.
Summary and key terms
- Companies often deliver only part of the value their strategies promise, mainly because of execution failures, especially coordination across units.
- Structure follows strategy: functional, divisional, matrix and network structures each favor different kinds of coordination.
- The star model and the 7-S framework show that structure, processes, rewards, people and values must align with strategy.
- Culture operates at the levels of artifacts, espoused values and underlying assumptions, and changes mostly through changed systems and behavior.
- The balanced scorecard measures financial, customer, internal process and learning and growth performance; strategy maps make the causal links explicit.
- OKRs and scorecards work when measures are few, owned, reviewed regularly and tied to resource allocation.
- Multidivisional structure
- An organization of semi-autonomous divisions with a general office responsible for strategy and capital allocation.
- Matrix structure
- A structure in which managers report along two dimensions, such as product and region.
- Star model
- Galbraith's framework aligning strategy, structure, processes, rewards and people.
- Balanced scorecard
- A set of measures from the financial, customer, internal process and learning and growth perspectives.
- Strategy map
- A diagram of the cause-and-effect links among strategic objectives across the scorecard perspectives.
- OKR
- An objective with a few measurable key results, usually set for a quarter.
Practice problems
Work each problem on paper first, then reveal the answer to check.
Why did Chandler argue that structure follows strategy?
Show answer
Diversified strategies overwhelmed centralized functional structures, so firms adopted multidivisional structures suited to their new strategies.
A measure moved from a baseline of 20 to 35 against a target of 50. What share of the way to the target has it come?
Show answer
(35 - 20) / (50 - 20) = 50 percent.
Give one artifact and one underlying assumption from an organization you know.
Show answer
An artifact might be an open-plan office; an underlying assumption might be that senior people make all important decisions.
Why should OKRs not be tied too tightly to pay?
Show answer
People may set easy targets or manipulate measures, defeating the purpose of focusing on ambitious priorities.
Lesson quiz · 5 questions
Score 60% or more to complete this lesson.
Create a free account to save your progress, take quizzes and earn a certificate.