
ITIL-150 · Lesson 3 of 12 · 21 min
Designing for experience: customers, users and employees
Two services can meet every target in their service level agreements and still leave people frustrated. The shipment portal may be available 99.9 % of the time while customers abandon half their bookings because the address form rejects rural routes. The service desk may resolve 95 % of tickets within target while staff dread contacting it. Experience is how people perceive and feel about their interactions with a product or service, and it is increasingly where value is won or lost.
This lesson covers the three experiences a service organization shapes (customer, user and employee), how to understand them with journey maps and research, how to design for them, how to measure them, and how experience level agreements complement service level agreements. Published summaries of ITIL (Version 5) give experience a prominent place alongside value and outcomes; the methods here come from user experience design and customer experience management, which ITIL draws on.
Three experiences
Customer experience (CX) is the whole relationship between an organization and the people or organizations that buy from it: marketing, sales, onboarding, use, billing, support and renewal. User experience (UX) is narrower: how it feels to use a particular product, such as the booking app. Employee experience (EX) is how staff experience their work, including the tools and services they rely on. In service management the three overlap. A Larchmont shipping clerk is a user of the booking app, and her company is the customer; a Larchmont dispatcher is an employee whose experience of the dispatch tool shapes how well customers are served.
| Experience | Whose | Scope | Larchmont example |
|---|---|---|---|
| Customer experience (CX) | Paying customers and their organizations | Every touchpoint over the relationship | A retailer's experience from quote to invoice to claims |
| User experience (UX) | People using a specific product | Interaction with one product or channel | A clerk booking a load in the app |
| Employee experience (EX) | Staff | Work, tools, services and environment | A dispatcher using the planning tool at 5 a.m. |
| Digital employee experience (DEX) | Staff using technology | Devices, apps, connectivity and IT support | Warehouse scanners that drop Wi-Fi in cold storage |
Experience is subjective, but that does not make it unmeasurable or unmanageable. It is shaped by things the organization controls: how easy tasks are, how fast and reliable systems are, how clear information is, how problems are handled and whether people feel respected. Good service design deliberately shapes those factors.
Journey mapping
A customer journey map shows the steps a person goes through to achieve a goal, across channels and over time, with what they do, think and feel at each step and where the organization supports or frustrates them. Journey maps are built from research, not assumptions: interviews, observation, support records and analytics. They reveal 'moments that matter', where experience has an outsized effect on satisfaction and loyalty, and pain points where effort, waiting or confusion pile up.
A service blueprint extends the journey map below the surface. Under each customer step it shows the frontstage actions (what staff and systems do that the customer sees), the backstage actions (what happens out of sight), the supporting processes and systems, and the lines of interaction and visibility between them. Blueprints connect experience to the practices, teams and suppliers that produce it, which is exactly where service management can act.
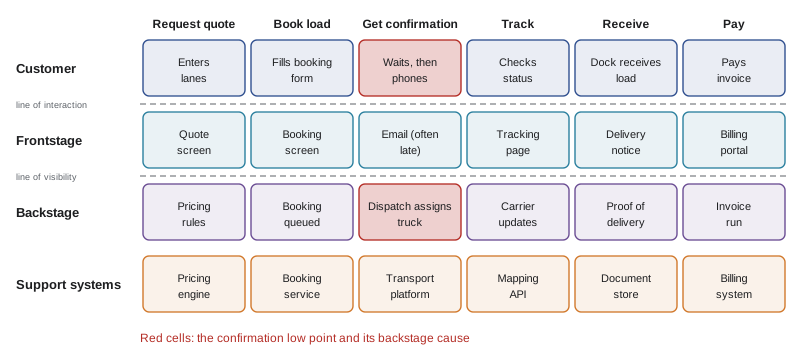
When Larchmont's designers mapped the journey of a mid-sized shipper, they found two low points. The first was confirmation: after booking online, customers did not know whether a truck had actually been assigned, so they phoned. The second was delay notification: when a pickup slipped, customers usually learned from their own staff on the loading dock rather than from Larchmont. Neither problem was in the portal itself. Both lived backstage, in dispatch and carrier processes.
Designing for experience
Experience design follows a cycle familiar from design thinking: understand people and their context, define the problem, generate ideas, prototype, test with real users and refine. The most important habit is testing early with real users. Five users in a usability test typically uncover most of the serious problems with a design, at a fraction of the cost of finding them after launch.
Several principles recur in good service experience design. Reduce effort: fewer steps, fewer fields, sensible defaults and saved information. Be proactive: tell people about problems before they discover them. Be consistent across channels: information given in the app should match what the call center says. Make recovery graceful: when things go wrong, make it easy to get help and fix the problem. Design for the edges: people with disabilities, poor connectivity, limited language skills or unusual cases are often where designs break.
Worked problem
Designing a delay notification
Pickups slip on about 7 % of Larchmont's 26,000 monthly bookings. Customers currently learn of delays from their docks, and about 60 % of delayed bookings generate a phone call averaging 6 minutes. If proactive notifications sent as soon as a delay is predicted cut those calls by two thirds, how much agent time is saved each month?
Show solution
- Delayed bookings = 7 % x 26,000 = 1,820.
- Calls now = 60 % x 1,820 = 1,092, using 1,092 x 6 = 6,552 minutes.
- Calls after = one third of 1,092 = 364, using 2,184 minutes.
- Saving = 6,552 - 2,184 = 4,368 minutes, about 73 hours a month.
Answer: About 73 agent hours a month, plus a better experience at a moment that matters. The design depends on backstage data: dispatch must predict delays early enough for the notification to help.
Accessibility and inclusion
An accessible product can be used by people with a wide range of abilities, including people who are blind or have low vision, are deaf or hard of hearing, have motor or cognitive disabilities, or are using assistive technology. The Web Content Accessibility Guidelines (WCAG), published by the World Wide Web Consortium, are the reference standard; version 2.2 was published in 2023. Accessibility is a legal duty in many settings and good design in all of them: captions, clear language, keyboard navigation and good contrast help everyone.
In the United States, Title III of the Americans with Disabilities Act has been applied by courts and the Department of Justice to many business websites, and the DOJ's 2024 rule under Title II set WCAG 2.1 Level AA as the standard for state and local government web content and apps, with compliance dates later extended to April 2027 for larger entities and April 2028 for smaller ones. Federal agencies must meet Section 508, which incorporates WCAG 2.0 Level AA. Lawsuits over inaccessible websites are common, so accessibility is also a legal risk for private companies like Larchmont.
Measuring experience
Experience measures fall into three families. Perception measures ask people how they feel: customer satisfaction (CSAT), Net Promoter Score (NPS), customer effort score (CES) and standard usability questionnaires such as the System Usability Scale (SUS). Behavioral measures observe what people do: task completion rate, time on task, abandonment, repeat contacts and channel switching. Operational measures capture the conditions that drive experience: page load times, error rates, wait times and first-contact resolution.
| Measure | How it works | Best for | Watch out for |
|---|---|---|---|
| CSAT | Rate satisfaction, often 1-5, right after an interaction | Specific touchpoints | Low response rates; only happy or angry people answer |
| NPS | Likelihood to recommend, 0-10; % promoters (9-10) minus % detractors (0-6) | Overall relationship | Sensitive to small samples; weak link to specific fixes |
| CES | How easy was it to get what you needed, often 1-7 | Support and self-service | Needs follow-up to know why |
| SUS | Ten standard statements, scored 0-100 | Comparing product usability over time | Measures usability only, not usefulness |
| Task completion and time | Observed success rate and duration | Specific journeys | Needs good instrumentation |
| Repeat contact rate | Share of issues needing another contact | Support quality | Requires linking contacts to issues |
No single number captures experience. Larchmont's experience dashboard combines a few measures per journey: for booking, completion rate, median time, SUS from quarterly tests and booking-related contact rate; for support, CES, first-contact resolution and repeat contacts; for the overall relationship, NPS from a twice-yearly survey of account decision-makers.
# Score NPS and SUS from small survey samples (invented data)
nps_answers = [10, 9, 9, 8, 7, 10, 6, 9, 3, 8, 9, 10, 5, 9, 7, 9, 10, 8, 2, 9]
promoters = sum(1 for a in nps_answers if a >= 9)
detractors = sum(1 for a in nps_answers if a <= 6)
nps = (promoters - detractors) / len(nps_answers) * 100
print(f"NPS: {promoters} promoters, {detractors} detractors of {len(nps_answers)} -> {nps:+.0f}")

# SUS: odd items positive (score - 1), even items negative (5 - score); sum x 2.5
responses = [
    [4, 2, 4, 1, 5, 2, 4, 2, 4, 2],
    [3, 3, 4, 2, 4, 3, 3, 3, 3, 2],
    [5, 1, 5, 1, 4, 1, 5, 2, 5, 1],
    [2, 4, 3, 3, 3, 4, 2, 4, 3, 3],
    [4, 2, 4, 2, 4, 2, 4, 1, 4, 2],
]
scores = []
for r in responses:
    total = sum((v - 1) if i % 2 == 0 else (5 - v) for i, v in enumerate(r))
    scores.append(total * 2.5)
print("SUS per user:", scores)
print(f"mean SUS: {sum(scores) / len(scores):.1f} (about 68 is often quoted as average)")NPS: 11 promoters, 4 detractors of 20 -> +35 SUS per user: [80.0, 60.0, 95.0, 37.5, 77.5] mean SUS: 70.0 (about 68 is often quoted as average)
With only 20 survey answers, the NPS of +35 could easily move 20 points with the next sample, so Larchmont reports NPS with its sample size and looks at trends over several surveys rather than single readings. The SUS mean of about 69 suggests average usability; the spread between users (from 40 to 95) matters as much as the mean, because it shows that some users struggle badly.
Experience level agreements
Traditional SLAs measure what the provider controls: availability, response and resolution times. An experience level agreement (XLA) adds targets for what users experience and how they feel, such as satisfaction, effort, productivity lost to IT problems or digital experience scores collected from devices. XLAs became popular in the late 2010s, especially for workplace IT, as organizations noticed the 'watermelon effect' from ITIL-141: green SLA reports covering red user experience.
XLAs do not replace SLAs; they complement them. A good XLA states the outcome users want, the experience indicators that show whether they are getting it, the operational indicators that drive it and the actions the provider will take when experience falls. Because perception measures are noisy, XLA targets are usually trends or thresholds with investigation triggers rather than penalties.
| Element | SLA example | XLA example |
|---|---|---|
| Focus | Provider performance | User outcome and perception |
| Typical measure | Portal availability 99.9 % in agreed hours | At least 85 % of booking sessions completed; CES 5.5 or better |
| Data source | Monitoring tools | Surveys, product analytics, device telemetry |
| When missed | Service credit or improvement plan | Joint investigation and experience improvement backlog |
Employee experience and digital employee experience
Employee experience matters to service management twice: employees are users of internal services, and their experience affects how well they serve customers. Digital employee experience (DEX) tools collect data from laptops and other devices, such as boot times, application crashes, Wi-Fi drops and slow logins, and combine it with short in-the-moment surveys. They let IT find and fix problems that users never report because they assume nothing will change.
Larchmont's warehouse staff use handheld scanners. Device telemetry showed that scanners in the cold-storage rooms at two of its distribution sites lost Wi-Fi an average of 11 times per shift, each drop costing about a minute of rescanning. Nobody had raised a ticket; staff had simply accepted it. Fixing the access point placement took two days and saved an estimated 300 staff hours a month across both sites.
Employee experience data needs care. Collecting device and application data about staff raises privacy questions, especially if it could be used to monitor individuals. Good practice is to be transparent about what is collected and why, aggregate where possible, limit access and use the data to fix problems rather than to judge people. Privacy law and, in some places, employment law set boundaries that must be respected.
Experience and the practices
Experience is not the job of one practice. Service design and user experience design shape it before launch; service level management adds experience measures to agreements; incident and problem management shape it when things go wrong; knowledge management decides whether self-service actually helps; relationship management hears what customers feel; continual improvement turns experience data into change. The value of a journey map or blueprint is that it shows all of these on one page, so that teams can see how their work adds up to what a person experiences.
Common mistakes
MistakeAssuming green SLA reports mean users are happy.
InsteadMeasure experience directly and look for the watermelon effect.
MistakeDesigning journeys from internal assumptions.
InsteadBuild journey maps from research with real customers, users and staff.
MistakeFixing only what is visible on screen.
InsteadUse service blueprints to find backstage causes of poor experience.
MistakeReporting single NPS readings from tiny samples.
InsteadShow sample sizes and track trends; combine perception with behavioral measures.
MistakeCollecting employee telemetry without transparency.
InsteadExplain what is collected, aggregate where possible and use it to fix problems, not to judge individuals.
Summary and key terms
- Experience is how people perceive and feel about their interactions; customer, user and employee experience overlap in service management.
- Journey maps show what people do, think and feel; service blueprints connect experience to frontstage, backstage and supporting systems.
- Good experience design reduces effort, is proactive and consistent, makes recovery graceful and designs for the edges, including accessibility.
- Experience is measured with perception, behavioral and operational measures; no single number is enough.
- Experience level agreements complement SLAs with targets for user outcomes and perception.
- Digital employee experience data can reveal unreported problems but must be handled transparently and respectfully.
- Customer journey map
- A visual account of the steps, thoughts and feelings of a person achieving a goal across channels and time.
- Service blueprint
- A diagram linking customer actions to frontstage, backstage and supporting processes and systems.
- Net Promoter Score (NPS)
- The percentage of promoters (9-10) minus the percentage of detractors (0-6) on a 0-10 recommendation question.
- System Usability Scale (SUS)
- A ten-item questionnaire scored from 0 to 100 that measures perceived usability.
- Experience level agreement (XLA)
- An agreement that sets targets for user outcomes and experience alongside traditional service levels.
Practice problems
Work each problem on paper first, then reveal the answer to check.
Distinguish customer experience from user experience.
Show answer
CX covers the whole relationship across all touchpoints; UX covers interaction with a specific product.
What does a service blueprint add to a journey map?
Show answer
It shows the frontstage, backstage and supporting processes and systems underneath each customer step.
Calculate NPS for 50 promoters, 30 passives and 20 detractors.
Show answer
50 % - 20 % = +30.
Why are XLA targets usually not tied to financial penalties?
Show answer
Perception measures are noisy and influenced by factors outside the provider's control, so they work better as triggers for joint improvement.
Give one privacy safeguard for digital employee experience data.
Show answer
Transparency, aggregation, limited access or using data only to fix problems rather than to judge individuals.
What were the two low points in Larchmont's booking journey and where did their causes lie?
Show answer
Booking confirmation and delay notification; both causes lay backstage in dispatch and carrier processes.
Lesson quiz · 5 questions
Score 60% or more to complete this lesson.
Create a free account to save your progress, take quizzes and earn a certificate.