
ITIL-141 · Lesson 3 of 12 · 27 min
Service level management II: measuring, reporting and reviewing
An agreement is only the start. Service level management earns its value in the months that follow: collecting the right data, reporting it honestly, talking with customers about what the numbers mean and acting when performance or needs change. This lesson covers the sources of service level information, the watermelon effect, how to build a service level report that customers trust, how service credits work, how to run a service review and how agreements evolve. ITIL-140 lesson 11 covered percentile reporting for support targets and experience level agreements; this lesson builds on that foundation and widens it to the whole service.
Sources of service level information
ITIL 4 describes several sources of information that service level management draws on. Customer engagement provides first-hand insight: initial conversations, regular service reviews and informal listening. Customer feedback comes through surveys, both event-based ones sent after a ticket or transaction and periodic ones that ask about the service overall. Key business-related metrics come from the business itself, such as orders processed, shipments booked or patients seen. Operational metrics come from the provider's tools: availability, response times, incident counts, change failures. Each source tells part of the story; none tells all of it.
| Source | What it shows | Limitation | Larchmont example |
|---|---|---|---|
| Operational metrics | Measured technical performance | May not reflect user experience | Portal availability 99.94 % in March |
| Event-based surveys | Satisfaction with a specific interaction | Low response rates, biased toward strong feelings | Post-ticket rating 4.3 out of 5 |
| Periodic surveys | Overall perception of a service | Infrequent, influenced by recent events | Quarterly survey: 62 % satisfied with the portal |
| Business metrics | Effect of the service on outcomes | Influenced by many non-IT factors | Bookings per hour fell 8 % on days with slow pages |
| Customer engagement | Context, priorities and emerging needs | Qualitative, depends on relationships | Dispatch managers say slow searches cost them trucks |
The watermelon effect
A watermelon SLA is green on the outside and red on the inside. Every reported target is met, but customers are unhappy. The term describes one of the most common failures in service level management, and its causes are usually easy to spot once you look for them. The targets may measure components rather than outcomes; they may average away bad periods; they may exclude the incidents that hurt most; they may cover only the provider's part of a chain that includes suppliers; or the customer's needs may have moved on since the targets were set.
Consider Larchmont. In the first quarter the LTS report shows every target green: portal availability above 99.9 %, priority 2 incidents resolved within target 93 % of the time and request fulfillment within target 91 % of the time. Yet the dispatch managers complain loudly, and the quarterly survey shows satisfaction with the portal falling from 78 % to 62 %. When the service level manager digs into the data, three things emerge. Availability is measured by a ping to the web server, which stayed up while searches timed out. The slowest searches clustered between 07:00 and 09:00, when dispatchers plan the day, but the monthly average hid them. And the incidents that caused the most frustration were logged as priority 3 because only one team reported them at a time.
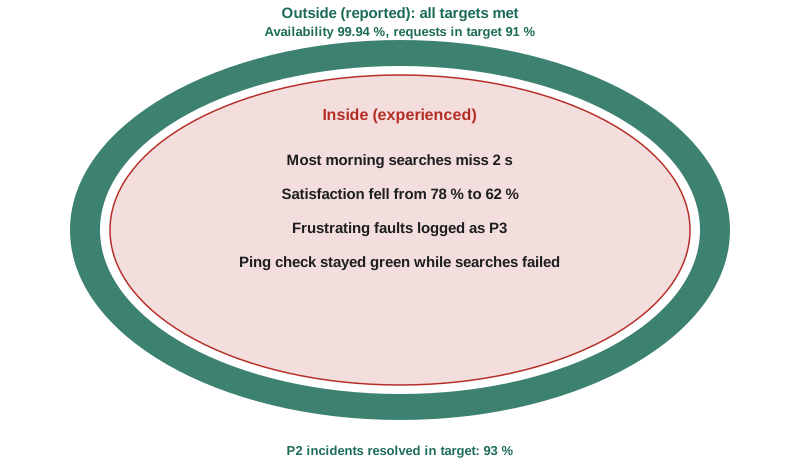
# The watermelon effect: monthly averages can hide the hours that matter
import random, statistics
random.seed(141)
# Simulated search response times (seconds) for 22 business days, 05:00-23:00
rows = []
for day in range(22):
    for hour in range(5, 23):
        base = 1.1
        if 7 <= hour < 9:           # morning planning peak
            base = 3.4
        for _ in range(40):          # 40 searches sampled per hour
            rows.append((hour, random.lognormvariate(0, 0.45) * base))

all_t = [t for _, t in rows]
peak = [t for h, t in rows if 7 <= h < 9]
target = 2.0
within = lambda xs: sum(1 for t in xs if t <= target) / len(xs) * 100
print(f"searches measured:          {len(all_t):,}")
print(f"monthly mean response:      {statistics.mean(all_t):.2f} s")
print(f"monthly median response:    {statistics.median(all_t):.2f} s")
print(f"within 2 s (whole month):   {within(all_t):.1f} %")
print(f"within 2 s (07:00-09:00):   {within(peak):.1f} %")
print(f"share of searches in peak: {len(peak) / len(all_t) * 100:.1f} %")searches measured: 15,840 monthly mean response: 1.50 s monthly median response: 1.18 s within 2 s (whole month): 81.9 % within 2 s (07:00-09:00): 12.7 % share of searches in peak: 11.1 %
The whole-month figure looks acceptable, but in the two hours that matter most to dispatchers, most searches miss the two-second target. Because the peak is only about a ninth of the searches, it barely moves the average. A report that showed the morning window separately, or that used a business-weighted indicator, would have made the problem visible months earlier.
Avoiding watermelons
Several practices help prevent watermelon reporting. Measure from the user's point of view, using synthetic transactions that perform real tasks and real user monitoring that records actual page loads. Report distributions and critical windows, not just averages. Include customer satisfaction and business metrics alongside operational ones, so a gap between them is visible. Review incidents by business impact, not just by recorded priority. Cover the whole chain, including supplier components. And above all, talk to customers regularly: a five-minute conversation can reveal what months of green reports conceal.
| Cause of the watermelon | Countermeasure |
|---|---|
| Targets measure components, not outcomes | Use end-to-end SLIs such as successful bookings |
| Averages hide bad periods | Report critical windows and percentiles |
| Low-priority incidents accumulate unseen | Review incident themes by business impact each month |
| Supplier parts of the chain are excluded | Measure the end-to-end service, including supplier components |
| Needs changed since targets were set | Review targets at least annually and after major business changes |
| Report is produced but not discussed | Hold regular service reviews with customers |
Building a trustworthy service level report
A good service level report is short, honest and useful. It starts with a plain-language summary of how the service performed and what customers experienced. It shows performance against each agreed target, with trends over several periods rather than a single snapshot. It explains breaches and near misses, including causes and actions. It includes customer satisfaction and relevant business metrics. It lists improvement actions and their status. And it avoids the temptation to bury bad news in footnotes or exclusions.
Exclusions deserve special care. Most SLAs exclude some events from the calculation, such as planned maintenance in agreed windows or outages caused by the customer. Exclusions are legitimate when they were agreed in advance and applied consistently. They become a problem when the provider stretches them, for example by labeling an emergency fix as planned maintenance. A trustworthy report shows both the figure with exclusions and the raw figure, so customers can see what was excluded.
Worked problem
Raw and adjusted availability
In a 30-day month with agreed service around the clock, the portal was unavailable for 95 minutes. Of these, 40 minutes were a planned maintenance window agreed with the customer and 15 minutes were caused by a customer-side network change. What are the raw and adjusted availabilities against a 99.9 % target?
Show solution
- Agreed minutes = 43,200.
- Raw availability = (43,200 − 95) ÷ 43,200 ≈ 99.78 %.
- Adjusted: exclude the 40-minute window from both agreed time and downtime, and exclude the 15 customer-caused minutes from downtime. Agreed time = 43,160; counted downtime = 40 minutes.
- Adjusted availability = (43,160 − 40) ÷ 43,160 ≈ 99.91 %.
Answer: Raw availability is about 99.78 %; adjusted availability is about 99.91 %, which meets the target. The report should show both and explain each exclusion.
Service credits and other consequences
External SLAs often include service credits: a reduction in charges when service levels are missed. Credits are usually tiered, for example 5 % of the monthly fee if availability falls below 99.9 %, 10 % below 99.5 % and 25 % below 99 %. Credits give the customer some compensation and give the provider an incentive, but they rarely cover the customer's real losses. A customer that loses a day of freight bookings will not be made whole by a 10 % discount on hosting fees. For that reason, credits should be seen as a signal and incentive, not as insurance.
Service credits can also distort behavior. A provider may focus on avoiding the credit threshold rather than on delivering a good service, or may argue over exclusions to avoid paying. Some organizations prefer earn-back arrangements, where a provider can recover credits by sustained good performance, or service improvement plans with agreed actions, which focus attention on fixing the cause.
# Tiered service credits from monthly availability (illustrative contract terms)
tiers = [(99.9, 0.00), (99.5, 0.05), (99.0, 0.10), (0.0, 0.25)]   # (lower bound %, credit share)
monthly_fee = 18_000.00
months = {"Jan": 99.95, "Feb": 99.87, "Mar": 99.41, "Apr": 99.92, "May": 98.70, "Jun": 99.90}

def credit_share(avail):
    for bound, share in tiers:
        if avail >= bound:
            return share
    return tiers[-1][1]

total = 0.0
for m, a in months.items():
    c = credit_share(a) * monthly_fee
    total += c
    print(f"{m}: availability {a:6.2f} %  credit {credit_share(a) * 100:4.0f} %  = {c:9,.2f}")
print(f"credits for half-year: {total:,.2f} of {monthly_fee * len(months):,.2f} in fees")Jan: availability 99.95 % credit 0 % = 0.00 Feb: availability 99.87 % credit 5 % = 900.00 Mar: availability 99.41 % credit 10 % = 1,800.00 Apr: availability 99.92 % credit 0 % = 0.00 May: availability 98.70 % credit 25 % = 4,500.00 Jun: availability 99.90 % credit 0 % = 0.00 credits for half-year: 7,200.00 of 108,000.00 in fees
Note that June, at exactly 99.90 %, earns no credit because the tier is defined as availability at or above 99.9 %. Precise wording about boundaries, rounding and measurement periods prevents disputes. A good SLA states whether availability is rounded before or after comparison with the target, which time zone defines the month and whose monitoring data is authoritative.
Running a service review
A service review is a regular meeting between the provider and the customer to discuss service performance, issues and changing needs. Reviews might be monthly for critical services and quarterly for others. A good review is a conversation, not a presentation. The provider shares the report in advance so time in the meeting goes on discussion. The agenda typically covers performance against targets, the customer's experience in their own words, significant incidents and problems, upcoming changes and business events, improvement actions and any need to change the agreement.
Reviews also build relationships. Customers who feel heard are more forgiving of the occasional failure and more willing to share early warnings about business changes, such as a new distribution center or a seasonal peak. Lesson 8 on relationship management returns to this.
| Agenda item | Purpose | Typical inputs |
|---|---|---|
| Performance against targets | Agree how the service performed | Service level report, trends |
| Customer experience | Hear what users actually felt | Survey results, comments, anecdotes |
| Major incidents and problems | Understand causes and actions | Post-incident reviews, problem records |
| Upcoming changes and business events | Coordinate plans and risks | Change schedule, business calendar |
| Improvement actions | Track progress on agreed improvements | Continual improvement register |
| Agreement changes | Keep targets aligned with needs | Proposed SLA revisions |
Service improvement plans
When a service consistently misses targets or customer satisfaction is falling, a service improvement plan (SIP) sets out agreed actions to restore performance. A SIP names the problem, the evidence, the root causes, the actions with owners and dates, and the measures that will show whether the plan worked. SIPs are entered in the continual improvement register and reviewed at each service review until they are closed. For Larchmont, the portal SIP included adding synthetic search transactions to monitoring, reporting the 07:00 to 09:00 window separately, tuning the search index and adding a second application server.
Reviewing and revising agreements
Agreements age. Business processes change, new services appear, user expectations rise and technology makes new levels possible. Each SLA should state when it will be reviewed, usually at least annually, and what triggers an earlier review, such as a significant business change or repeated breaches. During review, the service level manager checks whether each target still reflects business needs, whether it is still measured properly, whether OLAs and underpinning contracts still support it and whether the customer still values it. Targets that nobody cares about should be removed, because every target costs effort to measure and report.
Working with other practices
Service level management depends on many other practices. Monitoring and event management and measurement and reporting supply the data. Incident and problem management explain breaches. Change enablement and release management affect availability and need to respect agreed windows. Supplier management ensures underpinning contracts support SLAs. Relationship management keeps the wider relationship healthy. Continual improvement turns review findings into action. Service level managers often act as integrators, bringing information from all these practices together in a form customers can use.
Common metrics for the practice itself
The service level management practice can measure its own performance. Useful measures include the share of services with current, reviewed agreements; the share of targets measured end to end; the number of breaches and near misses and the share explained with actions; customer satisfaction with service reviews; the gap between operational metrics and satisfaction, which signals watermelons; and the time taken to respond to customer requests for changes to agreements.
Common mistakes
MistakeReporting only monthly averages.
InsteadShow critical windows, distributions and trends so bad periods are visible.
MistakeTreating green targets as proof of a good service.
InsteadCompare operational metrics with satisfaction and business metrics, and talk to customers.
MistakeStretching exclusions to avoid breaches.
InsteadApply only agreed exclusions consistently and show raw and adjusted figures.
MistakeSeeing service credits as compensation for business losses.
InsteadTreat credits as a signal and incentive; plan for business losses separately.
MistakeTurning service reviews into slide presentations.
InsteadSend the report in advance and use the meeting for conversation and decisions.
MistakeKeeping every target forever.
InsteadReview agreements regularly and remove targets customers no longer value.
Summary and key terms
- Service level management draws on operational metrics, surveys, business metrics and direct customer engagement.
- A watermelon report is green on the outside and red on the inside; it comes from measuring the wrong things or hiding bad periods.
- End-to-end measures, critical windows, satisfaction data and regular conversations prevent watermelons.
- Trustworthy reports show trends, explain breaches and show both raw and adjusted figures.
- Service credits signal and incentivize but rarely compensate real losses; precise boundary wording avoids disputes.
- Service reviews are conversations about performance, experience, plans and improvements.
- Service improvement plans restore performance, and agreements should be reviewed at least annually.
- Watermelon effect
- Reported targets are green while customers experience poor service.
- Service review
- A regular meeting between provider and customer to discuss performance, experience and needs.
- Service improvement plan
- A plan of agreed actions to restore or improve a service's performance.
- Service credit
- A reduction in charges when agreed service levels are missed.
- Earn-back
- An arrangement allowing a provider to recover service credits through sustained good performance.
- Exclusion
- An agreed event that does not count against a service level target.
- Event-based survey
- A survey sent after a specific interaction such as a resolved ticket.
- Periodic survey
- A survey asking about a service overall at regular intervals.
- Real user monitoring
- Measuring the actual experience of users as they use a service.
- Synthetic transaction
- A scripted test that performs a real user task to measure service performance.
Practice problems
Work each problem on paper first, then reveal the answer to check.
Name four sources of information used by service level management.
Show answer
Operational metrics, event-based surveys, periodic surveys, business metrics and customer engagement (any four).
What is a watermelon SLA?
Show answer
One where reported targets are green but customers are unhappy.
Give three causes of the watermelon effect.
Show answer
Any three of: measuring components not outcomes, averages hiding bad periods, low-priority incidents unseen, supplier parts excluded, needs changed.
In a 30-day 24×7 month the service was down 60 minutes, 20 of them in an agreed maintenance window. What is the adjusted availability?
Show answer
Agreed time 43,180 minutes, counted downtime 40 minutes: (43,180 − 40) ÷ 43,180 ≈ 99.91 %.
Why are service credits a poor substitute for insurance?
Show answer
They are usually a small share of fees and rarely cover the customer's real business losses.
Why should a service level report show raw and adjusted figures?
Show answer
So customers can see what was excluded and trust that exclusions were applied fairly.
List four items for a service review agenda.
Show answer
Performance against targets, customer experience, major incidents and problems, upcoming changes and business events, improvement actions, agreement changes (any four).
What does a service improvement plan contain?
Show answer
The problem, evidence, root causes, actions with owners and dates, and measures of success.
When should an SLA be reviewed?
Show answer
At least annually and after triggers such as major business changes or repeated breaches.
Why remove targets customers no longer value?
Show answer
Every target costs effort to measure and report and can distract from what matters.
Lesson quiz · 5 questions
Score 60% or more to complete this lesson.
Create a free account to save your progress, take quizzes and earn a certificate.