
ITIL-120 · Lesson 5 of 12 · 30 min
Collaborate and promote visibility
Service management work crosses boundaries. An incident may involve the service desk, a network team, an application team, a supplier and the affected business unit. A change may need input from developers, operations, security and the people who will use the result. When these groups work in isolation, information is lost at every handoff, problems are hidden until they become crises and decisions are made without the full picture. The fourth guiding principle asks organizations to work together across boundaries and to make work and its results visible. This lesson explains who to collaborate with, how to communicate with different stakeholders, why visibility matters and how to make it practical without drowning people in information.
What the principle asks
Collaborate and promote visibility means: working together across boundaries produces results that have greater buy-in, more relevance to objectives and increased likelihood of long-term success. Achieving objectives requires information, understanding and trust. Work and its consequences should be made visible, hidden agendas avoided and information shared to the greatest degree possible.
Applying the principle involves:
- Collaboration does not mean consensus: not everyone must agree, but the right people must be involved in the right way.
- Communicating in a way the audience can hear: different stakeholders need different messages, channels and levels of detail.
- Making decisions on visible data: decisions based on hidden or partial information are less likely to be good ones.
- Making work visible so that bottlenecks, waste and risks can be seen and addressed.
Collaboration versus cooperation
ITIL distinguishes collaboration from cooperation. Cooperation means groups pursue their own goals while helping each other where convenient. Collaboration means groups work together toward a shared goal, sometimes setting aside their own interests to achieve it. A service desk that passes tickets politely to a network team is cooperating. A service desk and network team that jointly own a target for restoring service, review incidents together and share knowledge are collaborating.
Silos are the opposite of collaboration. They form when teams are measured only on their own targets, use separate tools, sit in different places and rarely talk. A team that is rewarded for closing tickets quickly may close them by passing them on, even if the customer's problem remains unsolved. Breaking silos often means changing measures and structures, not just asking people to be friendlier.
Who to collaborate with
Collaboration is not only with obvious partners. ITIL encourages involving a wide range of stakeholders, including:
- Customers and users, who know what they need and how the service really performs.
- Internal teams across development, operations, security, finance and support.
- Suppliers and partners, who may hold critical knowledge and capabilities.
- Governance bodies, auditors and regulators, who need confidence that risks are controlled.
- People who seem unlikely partners, such as those who resist a change: understanding their concerns often improves the outcome.
| Stakeholder | What they typically need to know | Suitable channel |
|---|---|---|
| Executives and governing body | Outcomes, risks, decisions needed | Short briefings, scorecards |
| Customers and business managers | Service performance, planned changes affecting them | Service reviews, newsletters |
| Users | How to get help, what is changing and when | Portal notices, short messages |
| Technical teams | Detailed status, dependencies, work in progress | Boards, chat channels, stand-ups |
| Suppliers | Requirements, performance against contract | Supplier reviews, shared tickets |
Making work visible
Much of the work in IT is invisible. Unlike a physical production line, nobody can walk past and see a pile of unfinished changes or a queue of waiting requests. Invisible work cannot be managed well: bottlenecks persist because nobody sees them, urgent work crowds out important work, and people take on more than they can finish.
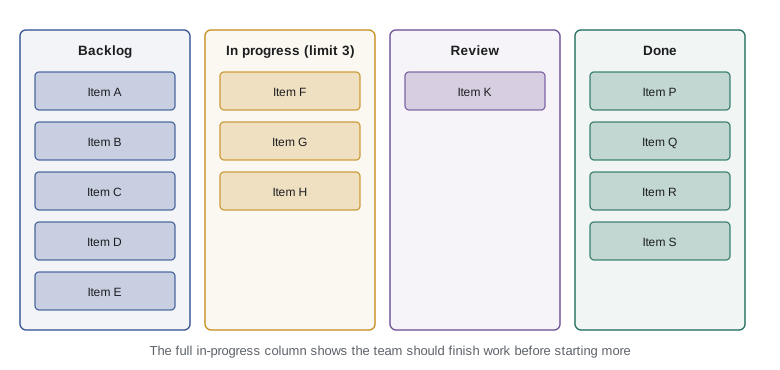
Visual management tools help. A kanban board shows each work item as a card moving through columns such as "to do", "in progress" and "done". Limits on work in progress (WIP limits) prevent too many items starting at once. Dashboards show service performance in real time. A shared change calendar shows what is planned and where conflicts may arise.
Worked problem
Finding a bottleneck with flow data
A change team tracks how long changes spend in each stage over a month. Averages: drafting 1.5 days, peer review 1 day, waiting for approval board 6 days, implementation 0.5 days, verification 1 day. What share of total time is spent waiting for approval, and what does it suggest?
Show solution
- Total time: 1.5 + 1 + 6 + 0.5 + 1 = 10 days.
- Waiting for approval: 6 ÷ 10 = 60 % of total time.
- Work time (excluding approval waiting): 4 days, or 40 %.
- Making this visible shows the approval board is the bottleneck; options include more frequent meetings or delegating approval of low-risk changes.
Answer: About 60 % of lead time is waiting for approval. Visible flow data points directly to the change authority as the place to improve.
Flow efficiency
The share of time that work is actively being worked on is called flow efficiency. In many service organizations it is surprisingly low, often well under 20 %, because work spends most of its life waiting in queues. Making flow visible is the first step to improving it.
Flow efficiency is calculated as \( \text{flow efficiency} = \dfrac{\text{active work time}}{\text{total lead time}} \times 100\% \).
Worked problem
Calculating flow efficiency
An access request takes 5 working days (40 working hours) from submission to completion. Active work on it totals 1.5 hours: 20 minutes to check eligibility, 10 minutes for manager approval, 60 minutes to configure access. What is the flow efficiency?
Show solution
- Active work time: 1.5 hours.
- Total lead time: 40 working hours.
- Flow efficiency: 1.5 ÷ 40 × 100 % ≈ 3.8 %.
- Over 96 % of the time, the request is waiting. Improvements should target queues and handoffs, not the speed of the configuration work.
Answer: Flow efficiency is about 3.8 %. The opportunity lies in reducing waiting, which is only obvious once the flow is visible.
Visibility and trust
Visibility builds trust, and trust enables collaboration. When a team shares its real performance, including problems, stakeholders learn they can rely on what it says. When problems are hidden, stakeholders discover them eventually and stop trusting all reports. The principle therefore asks for transparency about bad news as well as good: an honest account of a missed target, with a plan to recover, is worth more than a report that looks good but is not believed.
Visibility also has limits. Some information is confidential: personal data, security details, commercial terms. The principle asks for information to be shared "to the greatest degree possible", which means sharing as much as is safe and appropriate, not everything with everyone.
Avoiding information overload
More information is not always better visibility. Dashboards with dozens of measures, daily reports to people who do not need them, and notifications for every event can bury the signals that matter. Good visibility is selective: the right information, to the right people, at the right time, in a form they can understand.
Worked problem
Rationalizing reports
A team produces 18 recurring reports. A review finds 5 are read regularly and lead to decisions, 6 are read occasionally, and 7 have not been opened in three months. Each report takes on average 3 hours a month to produce. If the 7 unread reports are retired and the 6 occasional ones are replaced by 2 on-demand dashboards costing 4 hours a month in total, how many hours are saved monthly?
Show solution
- Current effort: 18 × 3 = 54 hours a month.
- Retiring 7 unread reports saves 7 × 3 = 21 hours.
- Replacing 6 occasional reports (18 hours) with dashboards (4 hours) saves 14 hours.
- Total saving: 21 + 14 = 35 hours a month; new effort 54 − 35 = 19 hours.
Answer: About 35 hours a month are saved, and the remaining reports are more likely to be read.
Links to other principles
This principle supports focus on value (stakeholders help identify what is valuable), start where you are (the people doing the work know the current state best) and think and work holistically (lesson 6), since seeing the whole system depends on information flowing across it. It is also central to DevOps, which emerged largely to break down the silo between development and operations teams, and to governance, which depends on accurate, visible information to evaluate, direct and monitor (lesson 10).
Practical techniques for collaboration
Several simple techniques make collaboration and visibility part of everyday work rather than an occasional effort:
- Daily stand-ups: short meetings where a team reviews its board, raises blockers and agrees who will help whom.
- Joint incident reviews: technical teams, the service desk and suppliers review significant incidents together, in a blameless format that focuses on learning.
- Shared service reviews with customers: regular meetings that look at performance, upcoming changes and customer priorities.
- Swarming: for complex incidents, bringing the right specialists together at once instead of passing the ticket from team to team.
- Open documentation: knowledge articles, runbooks and decisions stored where everyone who needs them can find them.
- Communities of practice: groups across teams that share expertise on a topic, such as automation or security.
Swarming deserves a closer look because it challenges the traditional tiered support model. In a tiered model, an incident moves from first-line to second-line to third-line support, waiting in a queue at each step. In swarming, the person who first receives a difficult incident pulls in whoever can help, and they work on it together. Swarming tends to reduce resolution time for complex issues and spreads knowledge across teams, though it needs clear rules so that specialists are not constantly interrupted.
Worked problem
Escalation chain versus swarming
A complex incident in a tiered model waits an average of 3 hours in each of two escalation queues and needs 2 hours of work in total. With swarming, the specialists join within 30 minutes and the combined work takes 2.5 hours because more people are involved. Compare the time to resolve.
Show solution
- Tiered: 3 + 3 hours of waiting + 2 hours of work = 8 hours.
- Swarming: 0.5 hours of waiting + 2.5 hours of work = 3 hours.
- Swarming uses a little more total effort but resolves the incident 5 hours sooner.
Answer: Swarming resolves the incident in about 3 hours instead of 8, at the cost of slightly more combined effort.
Whichever techniques are used, the test is the same: do the people who need information get it in time to act, and do teams work toward shared outcomes rather than defending their own boundaries? If the answer is yes, collaboration and visibility are working, whatever tools or meetings support them.
Key point to remember
Invisible work cannot be managed, and siloed teams cannot deliver end-to-end value. Make work and its results visible to those who need them, share bad news early, and give teams goals they can only achieve together.
Common mistakes
MistakeEquating collaboration with consensus.
InsteadInvolve the right people in the right way; not everyone has to agree.
MistakeSending everyone the same detailed report.
InsteadTailor content and channel to each audience.
MistakeHiding bad news until it is resolved.
InsteadShare problems early with a recovery plan to build trust.
MistakeAdding more dashboards to improve visibility.
InsteadMake visibility selective, focused on information that drives decisions.
MistakeAsking siloed teams to cooperate without changing their measures.
InsteadUse shared goals and measures that reward collaboration.
Summary and key terms
- Working together across boundaries produces greater buy-in, relevance and long-term success.
- Collaboration means shared goals; it does not mean everyone must agree.
- Involve a wide range of stakeholders, including unlikely partners such as resisters.
- Communicate in a way each audience can hear, with suitable content and channels.
- Visual management, such as kanban boards and WIP limits, makes invisible work manageable.
- Flow efficiency shows how much of lead time is active work; visibility exposes waiting.
- Visibility builds trust but should be selective and respect confidentiality.
- Collaboration
- Working together toward a shared goal, sometimes setting aside individual interests.
- Cooperation
- Pursuing separate goals while helping others where convenient.
- Silo
- A team or function that works in isolation from others.
- Kanban board
- A visual board showing work items as cards moving through stages.
- WIP limit
- A cap on the number of work items allowed in a stage at one time.
- Lead time
- The total time from a request being made to its fulfillment.
- Flow efficiency
- Active work time divided by total lead time.
- Bottleneck
- A stage in a process that limits the throughput of the whole.
- Transparency
- Openly sharing information, including bad news.
- Visual management
- Using visible displays to show the status of work and performance.
Practice problems
Work each problem on paper first, then reveal the answer to check.
What is the difference between collaboration and cooperation?
Show answer
Collaboration pursues a shared goal; cooperation pursues separate goals while helping where convenient.
Does collaboration require consensus?
Show answer
No. The right people must be involved appropriately, but not everyone must agree.
Why involve people who resist a change?
Show answer
Their concerns often reveal risks or improvements.
Lead time 20 hours, active time 2 hours. Flow efficiency?
Show answer
10 %.
What does a WIP limit do?
Show answer
Caps work in a stage so teams finish work before starting more.
Give an example of tailoring communication.
Show answer
Executives get a short scorecard; technical teams see detailed boards.
Why share bad news early?
Show answer
It builds trust and lets stakeholders help address the problem.
What limits apply to visibility?
Show answer
Confidential data, such as personal or security information, should be protected.
Approval waiting is 4 of 8 days. What share is it?
Show answer
50 %.
How do measures create silos?
Show answer
Teams measured only on their own targets optimize locally, even at others' expense.
Lesson quiz · 5 questions
Score 60% or more to complete this lesson.
Create a free account to save your progress, take quizzes and earn a certificate.