
GEOM-210 · Lesson 2 of 12 · 27 min
Measurement, errors and adjustment basics
Every measurement contains error. A distance measured twice with the same total station will rarely agree to the last millimeter, two level runs over the same route will close slightly differently, and a GNSS receiver left on a point will report a small cloud of positions rather than one fixed answer. Surveying is therefore as much about understanding and controlling error as it is about operating instruments. This lesson introduces the vocabulary of errors, the simple statistics surveyors use to describe precision, how errors combine when measurements are used in calculations, and the basic idea of adjusting redundant measurements so that they agree.
On the Coulee Ridge project, Leah's first task is to check a set of repeated distance measurements between two control points, CR-1 and CR-2, and decide how good the result is. Her questions are the same ones every surveyor asks: what is the best value, how precise is it, and is there anything wrong with any of the observations?
Mistakes, systematic errors and random errors
Errors fall into three groups, and each is handled differently.
- Mistakes, also called blunders, are gross errors caused by carelessness or confusion: reading 1.635 as 1.365, setting the prism on the wrong point, entering the wrong instrument height, or recording a rod reading against the wrong station. Mistakes are not errors in the statistical sense and cannot be averaged away. They are prevented by careful procedure and detected by independent checks, such as closing on known points and comparing repeated measurements.
- Systematic errors follow a physical or mathematical law and have the same sign and size under the same conditions. A steel tape that is 3 mm too long, a level whose line of sight tilts slightly upward, atmospheric conditions that slow the EDM signal, and Earth curvature over long sights all produce systematic errors. Repeating the measurement does not reduce them. They are removed by calibration and computed corrections, or canceled by field procedure, such as balancing backsight and foresight distances in leveling or measuring angles on both faces of the instrument.
- Random errors remain after mistakes are eliminated and systematic errors are corrected. They come from small, unpredictable variations in pointing, reading, centering and atmospheric conditions. They are equally likely to be positive or negative, small errors are more common than large ones, and they tend to follow a normal distribution. Random errors are reduced by repeating measurements and are described with statistics.
Precision and accuracy
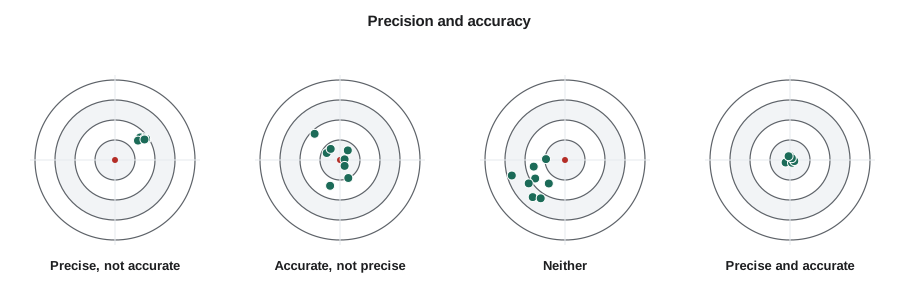
Precision describes how closely repeated measurements agree with each other. Accuracy describes how closely a measurement or the mean of measurements agrees with the true value. A set of measurements can be precise but inaccurate if a systematic error shifts all of them, for example a tape that is consistently too long. It can be imprecise but, on average, accurate if the random scatter is large but centered on the truth. Good surveying aims for both.
The mean, residuals and standard deviation
When a quantity is measured \(n\) times with equal care, the best estimate of its value is the arithmetic mean. The difference between each measurement and the mean is called a residual. Residuals always sum to zero, apart from rounding.
The spread of the measurements is described by the standard deviation, computed from the residuals. Because the mean itself was estimated from the same data, the sum of squared residuals is divided by \(n - 1\) rather than \(n\); the quantity \(n - 1\) is the number of redundant measurements, also called the degrees of freedom.
About 68 percent of measurements from a normal distribution fall within one standard deviation of the mean, about 95 percent within two standard deviations (more exactly 1.96), and 99.7 percent within three. Surveyors often quote results at 95 percent confidence, and survey standards frequently use a multiple of the standard deviation as the threshold for rejecting a suspect observation.
The mean of \(n\) measurements is more precise than any single measurement. Its standard deviation, called the standard error of the mean, decreases with the square root of the number of measurements. Doubling precision requires four times as many measurements, which is why surveyors improve precision mainly by better instruments and procedures rather than by endless repetition.
Worked problem
Repeated distance between CR-1 and CR-2
Grant's crew measures the horizontal distance between control points CR-1 and CR-2 six times with a total station, obtaining 412.374, 412.379, 412.371, 412.377, 412.380 and 412.375 m. Find the mean, the standard deviation of one measurement, and the standard error of the mean.
Show solution
- Mean:
- \[\bar{x} = \frac{2474.256}{6} = 412.376\ \text{m}\]
- Residuals in millimeters: \(-2, +3, -5, +1, +4, -1\). Their squares sum to \(4 + 9 + 25 + 1 + 16 + 1 = 56\) mm².
- \[s = \sqrt{\frac{56}{5}} = 3.3\ \text{mm}\]
- \[s_{\bar{x}} = \frac{3.3}{\sqrt{6}} = 1.4\ \text{mm}\]
Answer: The best value is 412.376 m. A single measurement has a standard deviation of about 3.3 mm, and the mean has a standard error of about 1.4 mm, so the distance is known to about ±2.8 mm at 95 percent confidence.
Detecting outliers
Before computing a final mean, surveyors look for observations that disagree with the rest by much more than random error would explain. A simple field rule is to reject any observation whose residual exceeds three standard deviations, but with small samples a blunder inflates the standard deviation itself and can hide. A better practice is to compare each value with the instrument's stated precision and with the other observations, investigate any outlier, and remeasure rather than simply discard it. If Grant's crew had recorded 412.437 m as the seventh measurement, the 61 mm residual would be obvious, and the likely cause, a transposed digit or a prism on the wrong point, would be checked in the field.
How errors propagate
Surveyors rarely use raw measurements directly. Distances are added to form a traverse, elevation differences are summed through a level run, and coordinates are computed from angles and distances. Each computed quantity inherits error from the measurements. For independent random errors, the standard deviation of a sum or difference is the square root of the sum of the squared standard deviations.
A useful consequence is that when \(n\) equal measurements with standard deviation \(\sigma\) are added, the total has a standard deviation of \(\sigma\sqrt{n}\). If each tape length in a 30-length taped distance has a random error of ±2 mm, the total has a random error of about ±11 mm, not ±60 mm, because random errors partly cancel. Systematic errors, in contrast, accumulate directly: a tape that is 2 mm too long gives an error of 60 mm over 30 lengths.
For a product such as an area computed from two measured sides, the relative errors combine. If a rectangle has sides \(a\) and \(b\) with standard deviations \(\sigma_a\) and \(\sigma_b\), the area \(A = ab\) has a standard deviation found from the general error propagation law, which uses the partial derivatives of the function:
Worked problem
Error in a lot area
A rectangular lot on the Coulee Ridge plat measures 60.00 ft by 120.00 ft (about 18.288 m by 36.576 m). Each side is measured with a standard deviation of 0.02 ft. What is the standard deviation of the area?
Show solution
- The area is \(A = 60.00 \times 120.00 = 7200.0\) ft².
- \[\sigma_A = \sqrt{(120.00 \times 0.02)^2 + (60.00 \times 0.02)^2} = \sqrt{5.76 + 1.44} = 2.68\ \text{ft}^2\]
Answer: The area is 7,200 ft² with a standard deviation of about 2.7 ft², a relative precision of about 1 part in 2,700.
Weights
When measurements have different precision, they should not be averaged equally. A measurement made with a better instrument, more repetitions or a shorter route deserves more influence. Surveyors assign each measurement a weight inversely proportional to its variance, \(w = 1/\sigma^2\), and compute the weighted mean. In leveling, the variance of a level run grows with its length, so weights are often taken as inversely proportional to the length of each route.
Worked problem
Weighted elevation of a new benchmark
The elevation of new benchmark BM-7 is determined by three level runs from different existing benchmarks: route A, 1.2 km long, gives 912.436 m; route B, 2.4 km, gives 912.442 m; route C, 0.8 km, gives 912.433 m. Weight each run inversely to its length and find the weighted mean.
Show solution
- Weights proportional to \(1/L\): \(w_A = 1/1.2 = 0.833\), \(w_B = 1/2.4 = 0.417\), \(w_C = 1/0.8 = 1.250\).
- \[\bar{x}_w = \frac{0.833(912.436) + 0.417(912.442) + 1.250(912.433)}{0.833 + 0.417 + 1.250}\]
- Working with the last three digits in millimeters: \(\frac{0.833(436) + 0.417(442) + 1.250(433)}{2.500} = \frac{1088.8}{2.500} = 435.5\).
Answer: The weighted elevation of BM-7 is 912.4355 m, or 912.436 m to the millimeter. The short route C has the most influence, and the simple mean of 912.437 m would give the long route too much weight.
# Statistics for repeated measurements and a weighted mean
import math, statistics

d = [412.374, 412.379, 412.371, 412.377, 412.380, 412.375]
mean = statistics.fmean(d)
s = statistics.stdev(d)                 # uses n - 1
se = s / math.sqrt(len(d))
print(f"mean = {mean:.4f} m, s = {s*1000:.1f} mm, s_mean = {se*1000:.1f} mm")
print("residuals (mm):", [round((x - mean) * 1000, 1) for x in d])
print(f"95% interval for the mean: +/- {1.96 * se * 1000:.1f} mm")

# Random versus systematic accumulation over 30 tape lengths
n, sig, bias = 30, 0.002, 0.002
print(f"random total = {sig * math.sqrt(n) * 1000:.1f} mm, systematic total = {bias * n * 1000:.0f} mm")

# Weighted mean of three level runs, weights = 1 / route length
runs = [(912.436, 1.2), (912.442, 2.4), (912.433, 0.8)]
w = [1 / L for _, L in runs]
xw = sum(wi * h for wi, (h, _) in zip(w, runs)) / sum(w)
print(f"weighted elevation = {xw:.4f} m; simple mean = {statistics.fmean(h for h, _ in runs):.4f} m")mean = 412.3760 m, s = 3.3 mm, s_mean = 1.4 mm residuals (mm): [-2.0, 3.0, -5.0, 1.0, 4.0, -1.0] 95% interval for the mean: +/- 2.7 mm random total = 11.0 mm, systematic total = 60 mm weighted elevation = 912.4355 m; simple mean = 912.4370 m
Redundancy and adjustment
A survey with exactly enough measurements to determine the unknowns has no check: any blunder passes straight into the result. Surveyors therefore measure more than the minimum. A closed traverse measures every angle of a polygon, even though the sum of the angles is known from geometry; a level loop returns to its starting benchmark, even though the total change in elevation must be zero. The extra measurements reveal the misclosure, which is the amount by which the measurements fail to satisfy the known condition.
If the misclosure is within the tolerance expected from random errors, the measurements are accepted and adjusted so that they satisfy the condition exactly. If it is too large, a mistake is suspected and the work is checked or repeated. Simple adjustments distribute the misclosure in proportion to some measure of the expected error, such as distance or number of setups. Lessons 4 and 7 apply simple rules to level loops and traverses. The rigorous method, least squares adjustment, finds the set of corrections that makes the measurements consistent while minimizing the weighted sum of the squared residuals. Least squares is used for control networks, GNSS processing and any survey with many interconnected measurements, and it also produces statistics on the precision of every adjusted coordinate.
| Survey | Known condition | Typical simple adjustment |
|---|---|---|
| Closed level loop | Sum of elevation differences = 0 | Distribute in proportion to distance or number of setups |
| Level line between benchmarks | Measured difference = known difference | Distribute in proportion to distance |
| Closed traverse angles | Sum of interior angles = \((n-2) \times 180°\) | Distribute equally among angles |
| Closed traverse coordinates | Sums of latitudes and departures = 0 | Compass (Bowditch) rule, in proportion to course length |
| Control network | Many geometric conditions | Least squares adjustment |
Significant figures and reporting
Computed values should be reported with a number of digits that reflects their precision. A distance measured to the nearest millimeter with a standard deviation of 3 mm should not be reported to a tenth of a millimeter, and an area computed from distances good to a centimeter should not be given to six decimal places of a square meter. During computation, however, surveyors carry extra digits to avoid rounding errors, and round only the final results. Field notes record what the instrument displayed, without rounding, so that later computations are not degraded.
Leah's report on the CR-1 to CR-2 distance therefore gives 412.376 m, standard deviation of the mean 1.4 mm, based on six observations, with a note that no outliers were found and that atmospheric corrections were applied in the instrument. That short statement tells any later user what the number is worth.
Common mistakes
MistakeTrying to average out a blunder by taking more measurements.
InsteadFind and remove the blunder; averaging only reduces random error.
MistakeRepeating a measurement to remove a systematic error such as a long tape.
InsteadRepetition does not help; calibrate and apply a correction, or use a procedure that cancels the error.
MistakeAdding standard deviations directly when combining independent random errors.
InsteadAdd the squares and take the square root.
MistakeAveraging measurements of different precision equally.
InsteadUse weights inversely proportional to the variance of each measurement.
Summary and key terms
- Errors are mistakes, systematic errors or random errors, and each is handled differently.
- Precision is the agreement among repeated measurements; accuracy is closeness to the true value.
- The mean is the best estimate; the standard deviation uses n − 1 and the standard error of the mean is s divided by the square root of n.
- Independent random errors combine as the square root of the sum of squares; systematic errors add directly.
- Weights are inversely proportional to variance, for example inversely proportional to route length in leveling.
- Redundant measurements reveal misclosures; acceptable misclosures are adjusted by simple rules or least squares.
- Blunder
- A gross mistake, such as a misread or misrecorded value, that must be found and removed.
- Systematic error
- An error that follows a physical or mathematical law and repeats under the same conditions.
- Random error
- A small unpredictable error that remains after blunders and systematic errors are removed.
- Residual
- The difference between a measurement and the adjusted or mean value.
- Standard deviation
- A measure of the spread of repeated measurements about their mean.
- Weight
- A measure of the relative reliability of a measurement, inversely proportional to its variance.
- Misclosure
- The amount by which redundant measurements fail to satisfy a known condition.
- Least squares
- An adjustment method that minimizes the weighted sum of squared residuals.
Practice problems
Work each problem on paper first, then reveal the answer to check.
Five measurements of an angle give 47°18′22″, 47°18′26″, 47°18′19″, 47°18′24″ and 47°18′24″. Find the mean and the standard deviation of one observation.
Show answer
Mean 47°18′23″; residuals −1, +3, −4, +1, +1 seconds; \(s = \sqrt{28/4} = 2.6''\).
How many measurements are needed to halve the standard error of a mean based on 4 measurements?
Show answer
16, because the standard error decreases with the square root of n.
Each of 16 setups in a level run has a standard deviation of 1.5 mm. What is the standard deviation of the total elevation difference?
Show answer
\(1.5\sqrt{16} = 6.0\) mm.
A tape is 4 mm too long per 30 m length. What is the error in a measured distance of 240 m?
Show answer
8 lengths × 4 mm = 32 mm; the measured distance is too short by 32 mm, so the correction is +32 mm.
Why is a measurement with a smaller standard deviation given a larger weight?
Show answer
Weight is inversely proportional to variance, so more precise measurements have more influence on the mean.
What does a large traverse misclosure suggest?
Show answer
A blunder in an angle or distance, which must be found and remeasured before adjustment.
Lesson quiz · 5 questions
Score 60% or more to complete this lesson.
Create a free account to save your progress, take quizzes and earn a certificate.