
GEOM-210 · Lesson 11 of 12 · 24 min
GIS, lidar, photogrammetry and drones
Traditional surveying measures one point at a time. Modern geomatics can also measure millions of points in minutes, from aircraft, drones, vehicles and tripod-mounted scanners, and it stores, analyzes and shares spatial data in geographic information systems. These technologies have changed how engineers see a site: instead of a few cross-sections, they work with complete three-dimensional models. This lesson introduces geographic information systems, photogrammetry and the ground sample distance, lidar and laser scanning, drone surveying and its regulations, and how the accuracy of mass data is checked.
Theo Martel runs this side of Coulee Geomatics. For the Coulee Ridge subdivision he flew the site with a drone to build an orthophoto and a surface model, combined the results with municipal utility records in the firm's GIS, and used the surface to compute earthwork volumes for comparison with the cross-section and grid methods of lesson 5.
Geographic information systems
A geographic information system (GIS) stores spatial data together with descriptive information and provides tools to query, analyze and map it. Spatial data come in two main forms. Vector data represent features as points, lines and polygons: a hydrant is a point, a water main is a line and a lot is a polygon. Each feature carries attributes, such as pipe material, diameter, installation date or lot owner, in a linked table. Raster data represent continuous surfaces or images as grids of cells, such as an orthophoto, a digital elevation model or a land cover classification.
GIS organizes data in layers that share a coordinate system, so that utilities, parcels, contours, zoning and aerial imagery can be overlaid and analyzed together. Typical engineering uses include finding all lots within a flood zone, tracing which valves isolate a broken water main, estimating the population served by a pump station, and checking design alternatives against environmental constraints. Municipalities maintain GIS databases of their infrastructure assets, and many publish open data portals from which engineers can download parcels, imagery and elevation data.
GIS data are only as good as their sources. A utility line digitized decades ago from a paper drawing may be several meters from its real position, while a survey-grade as-built may be good to a centimeter. Good GIS data carry metadata describing their source, date, coordinate system and accuracy, and surveyors and engineers must read it before using the data for design. On the Coulee Ridge project, the municipal water main location in the GIS was used for planning, but Grant's crew located the main in the field, with the utility owner's locate marks and test holes, before the design was finalized.
Photogrammetry
Photogrammetry is the science of making measurements from photographs. When the same ground point appears in two or more overlapping images taken from different positions, its three-dimensional position can be computed by intersecting the rays from the cameras, just as a total station intersection uses two directions. Modern photogrammetry uses structure-from-motion software, which automatically finds thousands of matching features in overlapping images, computes the camera positions and orientations, and builds a dense three-dimensional point cloud, a surface model and an orthophoto, which is a mosaic of images corrected so that it has a uniform scale like a map.
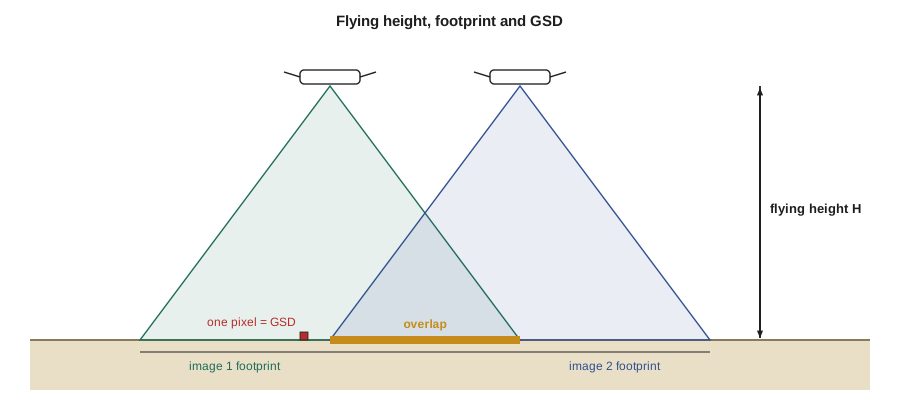
Photogrammetric surveys are planned with large overlaps between images: typically about 75 to 80 percent forward overlap along each flight line and 60 to 70 percent side overlap between lines. The resolution of the imagery is expressed as the ground sample distance (GSD), the size of one image pixel on the ground. It depends on the camera's sensor width, focal length and image width in pixels, and on the flying height above the ground:
As a rule of thumb, a well-controlled drone photogrammetry survey can achieve horizontal accuracy of about one to two times the GSD and vertical accuracy of about two to three times the GSD on open, hard surfaces, provided there is good ground control. Accuracy is much worse in tall grass, crops and shadows, and photogrammetry cannot see the ground under dense vegetation.
Worked problem
Planning the Coulee Ridge drone flight
Theo's drone camera has a sensor 13.2 mm wide, a focal length of 8.8 mm and images 5,472 pixels wide by 3,648 pixels high. Find the GSD at a flying height of 100 m, the height needed for a GSD of 2.0 cm, and the spacing of flight lines at 100 m with 70 percent side overlap.
Show solution
- \[GSD = \frac{13.2 \times 100}{8.8 \times 5472} = 0.0274\ \text{m} = 2.74\ \text{cm}\]
- For a 2.0 cm GSD: \(H = \frac{0.020 \times 8.8 \times 5472}{13.2} = 73.0\) m.
- Image footprint across the flight line at 100 m: \(5472 \times 0.0274 = 150\) m.
- \[\text{line spacing} = (1 - 0.70) \times 150 = 45\ \text{m}\]
Answer: At 100 m (328 ft) the GSD is about 2.7 cm (about 1.1 in) and flight lines are 45 m (about 148 ft) apart. Flying at 73 m (240 ft) gives a 2.0 cm GSD but needs more lines and more images. Both heights are within the 400 ft limit above ground of the FAA's small drone rules.
Ground control and checkpoints
Photogrammetric models must be tied to the project coordinate system. Traditionally this is done with ground control points: targets, often painted crosses or checkerboard panels, placed around the site and surveyed with GNSS or a total station before the flight. The software uses them to scale, orient and georeference the model. Drones with onboard RTK or post-processed kinematic (PPK) GNSS record accurate camera positions and need fewer control points, but at least a few are still recommended, especially to control the vertical.
Independent checkpoints are surveyed points that are not used in the processing. Comparing the model with the checkpoints gives an honest measure of accuracy, usually expressed as a root mean square error (RMSE). Accuracy standards, such as the American Society for Photogrammetry and Remote Sensing positional accuracy standards widely used in both countries, define accuracy classes in terms of RMSE and specify how many checkpoints are needed and how they should be distributed.
Worked problem
Checking the surface model
Eight checkpoints on paved and gravel surfaces give model-minus-survey elevation differences of +0.021, −0.034, +0.012, +0.028, −0.018, +0.040, −0.025 and +0.009 m. Compute the vertical RMSE, the mean error, and an approximate 95 percent vertical accuracy.
Show solution
- Sum of squares: \(0.000441 + 0.001156 + 0.000144 + 0.000784 + 0.000324 + 0.001600 + 0.000625 + 0.000081 = 0.005155\) m².
- \[RMSE_z = \sqrt{0.005155/8} = 0.0254\ \text{m}\]
- Mean error: \(0.033/8 = +0.004\) m, so there is no significant bias.
- \[\text{95 percent accuracy} \approx 1.96 \times 0.0254 = 0.050\ \text{m}\]
Answer: The vertical RMSE is about 2.5 cm, close to the GSD, with no significant bias, and about 5 cm at 95 percent confidence. That suits earthwork volumes and site grading design, but not the final grades of curbs and pipes.
Lidar and laser scanning
Lidar, short for light detection and ranging, measures distances with laser pulses. Combined with precise positioning and orientation from GNSS and inertial measurement units, each returned pulse becomes a three-dimensional point. Airborne lidar flown from aircraft covers large areas and is the main source of modern regional elevation models; many provinces, states and the federal governments of both countries have released lidar elevation data. Mobile lidar mounted on vehicles maps road corridors at highway speeds. Terrestrial laser scanners on tripods capture buildings, bridges, plants and excavations in great detail, and many total stations now include scanning functions. Drone lidar brings airborne methods to small sites.
A key advantage of lidar over photogrammetry is that a single laser pulse can produce several returns as parts of it reflect off leaves, branches and finally the ground. The last returns under vegetation allow the bare ground to be mapped beneath tree canopy, which photogrammetry cannot do. Lidar points are classified, by software and by manual editing, into categories such as ground, low, medium and high vegetation, buildings and water. Lidar point density is expressed in points per square meter and ranges from a few points per square meter for regional mapping to hundreds or thousands for drone and mobile surveys.
| Product | What it represents | Typical use |
|---|---|---|
| Point cloud | Millions of three-dimensional points, with intensity and classification | Source data for all other products; as-built modeling |
| Digital surface model (DSM) | The top surface, including buildings and trees | Line-of-sight, solar and flight obstruction studies |
| Digital terrain model (DTM) | The bare ground with buildings and vegetation removed | Grading, drainage, earthwork, contours |
| Orthophoto | A scale-corrected image mosaic | Base map, feature mapping, progress records |
| Contours | Lines of equal elevation from the DTM | Plan drawings and design base maps |
Drone regulations
Drones used for surveying are regulated by the Federal Aviation Administration. Commercial operations of small drones, under 55 lb, are flown under the Part 107 rules, which require a remote pilot certificate, registration of the drone, broadcast Remote ID, operation within visual line of sight, generally no higher than 400 ft above the ground, and authorization before flying in controlled airspace near airports. Waivers allow some operations outside these limits. The FAA proposed a new Part 108 rule in 2025 to allow routine flights beyond visual line of sight; as of late 2026 the final rule was still in review. Operators must also respect state privacy and trespass laws, local ordinances and landowner permission for take-off and landing.
Beyond the regulations, drone surveys need practical planning: checking airspace and nearby airports, weather and wind limits, battery planning, a safe take-off and landing area, visual observers where needed, and communication with people on the site. On construction sites, drone flights must be coordinated with crane operations and site safety rules.
# Drone flight planning and checkpoint accuracy
import math

sensor_w_mm, focal_mm, img_w_px, img_h_px = 13.2, 8.8, 5472, 3648

def gsd(height_m):
    return sensor_w_mm * height_m / (focal_mm * img_w_px)

for h in (60, 73, 100, 120):
    g = gsd(h)
    across, along = g * img_w_px, g * img_h_px
    print(f"H {h:3d} m ({h / 0.3048:3.0f} ft): GSD {g * 100:.2f} cm, footprint {across:.0f} x {along:.0f} m, "
          f"line spacing {0.30 * across:.0f} m, photo spacing {0.20 * along:.0f} m")

# Number of flight lines and images for a 600 m x 450 m site at 100 m
g = gsd(100)
lines = math.ceil(600 / (0.30 * g * img_w_px)) + 1
photos_per_line = math.ceil(450 / (0.20 * g * img_h_px)) + 1
print(f"site 600 x 450 m: about {lines} lines x {photos_per_line} photos = {lines * photos_per_line} images")

# Checkpoint statistics
dz = [0.021, -0.034, 0.012, 0.028, -0.018, 0.040, -0.025, 0.009]
rmse = math.sqrt(sum(d * d for d in dz) / len(dz))
print(f"RMSEz = {rmse * 100:.1f} cm, mean error = {sum(dz) / len(dz) * 100:+.1f} cm, 95% ~ {1.96 * rmse * 100:.1f} cm")H 60 m (197 ft): GSD 1.64 cm, footprint 90 x 60 m, line spacing 27 m, photo spacing 12 m H 73 m (240 ft): GSD 2.00 cm, footprint 109 x 73 m, line spacing 33 m, photo spacing 15 m H 100 m (328 ft): GSD 2.74 cm, footprint 150 x 100 m, line spacing 45 m, photo spacing 20 m H 120 m (394 ft): GSD 3.29 cm, footprint 180 x 120 m, line spacing 54 m, photo spacing 24 m site 600 x 450 m: about 15 lines x 24 photos = 360 images RMSEz = 2.5 cm, mean error = +0.4 cm, 95% ~ 5.0 cm
Choosing a method
Each method has strengths. Total stations and GNSS give the highest accuracy on individual points and are essential for control, legal surveys, layout and checking. Drone photogrammetry is fast and economical for open sites, stockpiles and progress monitoring, and gives excellent imagery. Lidar penetrates vegetation, captures complex structures and works in poor light. Terrestrial scanning records existing buildings and plant rooms in detail for renovation design. GIS ties all of it together with records of ownership, utilities and assets. Most projects use a combination: on Coulee Ridge, total station and GNSS control, leveled benchmarks, a drone surface for earthwork, field shots of hard features and utilities, and GIS for planning and records.
Whatever the method, the deliverable must state its coordinate system, its accuracy and how that accuracy was verified. A beautiful three-dimensional model with an unknown datum or untested accuracy is a hazard, not an asset.
Common mistakes
MistakeDesigning from GIS utility lines without field verification.
InsteadTreat GIS records as approximate; locate and expose utilities in the field before design and construction.
MistakeReporting drone survey accuracy from the control points used in processing.
InsteadUse independent checkpoints that were not used in the processing.
MistakeUsing a photogrammetric surface under tall grass or trees as bare ground.
InsteadPhotogrammetry measures the top of vegetation; use lidar or field shots for ground under cover.
MistakeFlying a drone without checking airspace, certificates and permissions.
InsteadFollow the aviation regulations, check airspace, and get landowner and site permission.
Summary and key terms
- A GIS stores vector and raster data in layers with attributes and metadata; its accuracy depends on its sources.
- Photogrammetry computes three-dimensional points from overlapping images; GSD = sensor width × H / (focal length × image width).
- Drone photogrammetry with good control can reach accuracy of a few GSD; it cannot see the ground under dense vegetation.
- Lidar measures with laser pulses, can record multiple returns through vegetation, and produces classified point clouds.
- Independent checkpoints and RMSE statistics measure the accuracy of mass data.
- Drone flights are regulated by Transport Canada or the FAA, with certificates, registration and altitude and visual line-of-sight limits.
- GIS
- A geographic information system that stores, analyzes and maps spatial data and attributes.
- Vector data
- Spatial data represented as points, lines and polygons.
- Raster data
- Spatial data represented as a grid of cells, such as images or elevation models.
- Orthophoto
- An aerial image mosaic corrected to a uniform scale.
- Ground sample distance
- The size of one image pixel on the ground.
- Lidar
- Light detection and ranging, which measures distances with laser pulses.
- Digital terrain model
- A model of the bare ground surface with buildings and vegetation removed.
- Checkpoint
- An independently surveyed point used to test the accuracy of a model, not to build it.
Practice problems
Work each problem on paper first, then reveal the answer to check.
A camera with a 6.3 mm sensor width, 4.5 mm focal length and 4,000-pixel image width flies at 80 m. Find the GSD.
Show answer
\(6.3 \times 80/(4.5 \times 4000) = 0.028\) m, or 2.8 cm.
Why are large forward and side overlaps used in photogrammetry?
Show answer
So every ground point appears in several images, allowing reliable matching and three-dimensional computation.
Five checkpoints have errors of 0.03, −0.02, 0.01, −0.04 and 0.02 m. Find RMSEz.
Show answer
\(\sqrt{0.0034/5} = 0.026\) m.
What is the difference between a DSM and a DTM?
Show answer
A DSM includes buildings and vegetation; a DTM is the bare ground.
Why can lidar map the ground under trees when photogrammetry cannot?
Show answer
Parts of each laser pulse pass through gaps in the canopy, and the last returns come from the ground.
Why are independent checkpoints needed in addition to ground control points?
Show answer
Control points are used to fit the model, so they understate the error; checkpoints test it honestly.
Lesson quiz · 5 questions
Score 60% or more to complete this lesson.
Create a free account to save your progress, take quizzes and earn a certificate.