
CRE-460 · Lesson 3 of 12 · 30 min
Market research and choosing target markets
Lesson 1 showed how to read existing audience data and lesson 2 surveyed where audiences gather. This lesson turns those inputs into a decision: which one or two markets to pursue first, and how to test that choice before committing serious money. Good market selection combines evidence of demand, an honest view of the creator's ability to serve the market, and a realistic estimate of the value the market can bring. It also includes a plan for a small, measurable test, so that the creator learns quickly whether the market is worth more investment.
Defining a market
A market for a creator is a group of potential viewers who share the conditions that matter for your content: usually a language, often a country or region, sometimes a culture or diaspora, and always an interest in your niche. "Spanish speakers" is too broad to plan around; "Spanish-speaking home cooks in Mexico and the US who watch budget recipe content" is a market. Defining the market precisely makes every later choice easier: which dialect to use in subtitles, which time zone to post for, which sponsors to approach and which cultural references to check.
Markets can be defined by language first or by country first. Language-first markets suit content where the spoken word matters and where one language spans many countries, such as Spanish, Portuguese, French, Arabic or Hindi. Country-first markets suit content tied to local conditions, such as personal finance, law, shopping or travel, where a video for Mexico differs from one for Spain even though both are in Spanish.
Sizing a market: a simple top-down estimate
A top-down estimate starts with the population and narrows it step by step. The figures are illustrative and the method is rough, but it forces you to state your assumptions, which you can then test.
Worked problem
Sizing a Portuguese-language market in Brazil
A fitness creator considers Brazil. Assume (illustratively) 180 million internet users, 85 % of whom use the target video platform, 98 % comfortable with Portuguese content, and 4 % interested in home workout content. Estimate the reachable audience. If the creator could reach 0.5 % of it in two years, how many viewers is that?
Show solution
- Platform users: \( 180{,}000{,}000 \times 0.85 = 153{,}000{,}000 \).
- Portuguese-comfortable: \( 153{,}000{,}000 \times 0.98 \approx 149{,}900{,}000 \).
- Interested in home workouts: \( 149{,}900{,}000 \times 0.04 \approx 6{,}000{,}000 \).
- Reaching 0.5 %: \( 6{,}000{,}000 \times 0.005 = 30{,}000 \) viewers.
Answer: The reachable audience is about 6 million people, and a realistic two-year goal might be about 30,000 regular viewers. The value of the exercise is less in the final number than in the assumptions, each of which the creator can check against data.
Top-down figures are best combined with bottom-up evidence: how many people search for your topic in the target language, how many views comparable local creators get, and how your own content performs when shown to that market. Search tools, platform keyword suggestions and the public view counts of similar channels give useful bottom-up signals.
Advertising value and audience mix
Different markets bring different revenue per view. Revenue per thousand views (RPM) depends on how much advertisers pay to reach viewers in that country, the platform's revenue share, and the niche. An audience mix that shifts toward lower-RPM markets can raise views while lowering average revenue per view. Creators should therefore calculate a blended RPM rather than assume their home-market rate applies everywhere.
where \( s_i \) is the share of views from market \( i \).
Worked problem
Blended RPM after adding a market
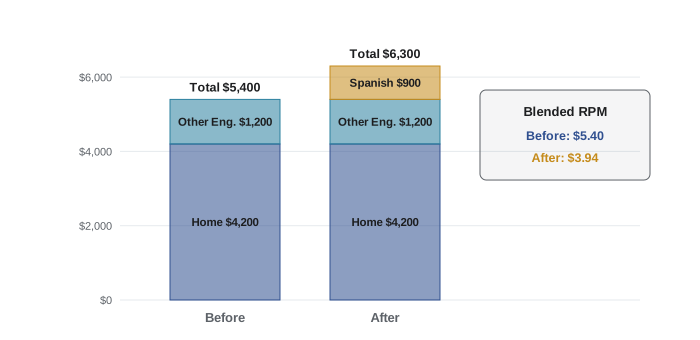
A channel gets 1,000,000 monthly views: 70 % from a home market at an RPM of $6.00 and 30 % from other English-speaking markets at $4.00. A Spanish-language push adds 600,000 monthly views at an RPM of $1.50. What is the blended RPM before and after, and how does monthly ad revenue change?
Show solution
- Before: \( 0.70 \times 6.00 + 0.30 \times 4.00 = 4.20 + 1.20 = \$5.40 \).
- Revenue before: \( 1{,}000 \times 5.40 = \$5{,}400 \).
- Added revenue: \( 600 \times 1.50 = \$900 \). Revenue after: \( \$6{,}300 \).
- Blended RPM after: \( 6{,}300 / 1{,}600 \approx \$3.94 \).
Answer: Revenue rises from $5,400 to $6,300 a month, even though the blended RPM falls from $5.40 to about $3.94. A falling average RPM is not a problem if total revenue and other benefits grow; it simply reflects a broader audience.
A weighted market scorecard
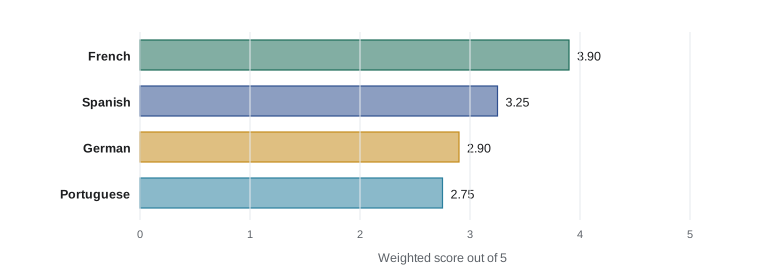
When several markets look promising, a weighted scorecard makes the comparison explicit. Choose criteria that matter for your goals, weight them, score each market from 1 to 5 on each criterion, and multiply. The scores are judgments, but writing them down exposes disagreements and assumptions.
| Criterion (weight) | Spanish (Latin America) | Portuguese (Brazil) | French (Europe and Canada) | German |
|---|---|---|---|---|
| Evidence of existing demand (30 %) | 4 | 3 | 3 | 2 |
| Advertising and sponsor value (20 %) | 2 | 2 | 4 | 5 |
| Ease of serving: language skills, partners (20 %) | 3 | 2 | 5 | 2 |
| Content fit and cultural distance (15 %) | 4 | 4 | 4 | 3 |
| Legal, tax and payment complexity, higher is easier (15 %) | 3 | 3 | 4 | 3 |
| Weighted score | 3.25 | 2.75 | 3.90 | 2.90 |
Worked problem
Calculating a weighted score
Check the weighted score for the French market in the table.
Show solution
- Demand: \( 3 \times 0.30 = 0.90 \).
- Value: \( 4 \times 0.20 = 0.80 \).
- Ease: \( 5 \times 0.20 = 1.00 \).
- Fit: \( 4 \times 0.15 = 0.60 \). Complexity: \( 4 \times 0.15 = 0.60 \).
- Total: \( 0.90 + 0.80 + 1.00 + 0.60 + 0.60 = 3.90 \).
Answer: French scores 3.90, highest of the four, mainly because the creator in this example is bilingual and the market has good sponsor value. A creator without French skills would score ease lower and might reach a different answer, which is exactly why the scorecard should reflect your own situation.
Qualitative research
Numbers alone miss important information. Before entering a market, spend time understanding it as a viewer. Watch the most popular creators in your niche in that language: what formats, lengths, tones and thumbnail styles do they use? What do commenters praise and complain about? Which topics are saturated, and which are missing? Talk to people: viewers from the market who already watch you, creators there who might collaborate, and agencies or brand managers who work in the market. Even five or six conversations reveal assumptions you did not know you were making.
- Competitive scan: list ten leading creators in your niche in the target language, with their formats, posting frequency, typical views and sponsors.
- Comment mining: read several hundred comments on popular videos in the market to learn the vocabulary, jokes and frustrations of viewers.
- Search research: compare search volumes for key terms in the target language and note phrasing that differs from direct translation.
- Interviews: ask existing viewers from the market what they enjoy, what confuses them and what they would like to see.
- Cultural check: identify topics, symbols or practices that need care, a subject lesson 6 develops.
Testing before committing
A market test is a small, time-limited experiment designed to learn whether a market responds before investing heavily. Common tests include adding professional subtitles in the target language to ten or twelve existing videos, publishing a few dubbed versions, posting short clips on a separate regional account, or collaborating with one creator from the market. CRE-440 covered experiment design; the same principles apply here: state a hypothesis, choose a primary metric in advance, decide the sample size or duration, and compare against a sensible baseline.
A good primary metric for a language test is watch time or average view duration from the target market, compared with similar videos without the localization. Views alone can be misleading because the platform may show localized videos to more people in that market without those viewers staying.
Worked problem
Sample size for a subtitle test
A creator wants to know whether Spanish subtitles raise the share of Spanish-market viewers who watch past the one-minute mark, currently about 30 %. They want to detect an increase to 36 %. Using the rough rule from CRE-440 for comparing two proportions, \( n \approx 16 \, p(1-p) / \delta^2 \) per group, with \( p = 0.33 \) and \( \delta = 0.06 \), how many Spanish-market viewers are needed in each group?
Show solution
- \( p(1-p) = 0.33 \times 0.67 \approx 0.221 \).
- \( \delta^2 = 0.06^2 = 0.0036 \).
- \( n \approx 16 \times 0.221 / 0.0036 \approx 982 \) per group.
Answer: Roughly 1,000 Spanish-market viewers per group are needed to detect a 6-point improvement with reasonable confidence. A channel that gets only a few hundred such viewers a month should run the test longer or look for a bigger effect.
Set a decision rule before the test: for example, if subtitled videos show at least 20 % more watch time from the target market after eight weeks, the creator will commit to subtitling all new uploads and start a dubbing pilot; if not, the creator will try a different market or format. Decision rules prevent the common trap of reading whatever result arrives as encouraging.
Choosing one or two markets
The output of market research is a short, written decision: the market or markets chosen, the reasons, the kind of value expected, the first test and its decision rule, the budget and who will do the work. Most creators do best by choosing one primary new market and at most one secondary market for the first year. A focused entry builds the critical mass of engaged viewers that lesson 1 described, and it teaches lessons that make the next market easier.
| Element | Example |
|---|---|
| Market | French-speaking viewers in Quebec and France interested in budget home renovation |
| Reason | Strongest weighted score; creator is bilingual; 6 % of watch time already from France and Quebec |
| Value sought | Reach and sponsorships from Quebec and French home-improvement brands |
| First test | French subtitles and translated titles on 12 videos plus 6 French short clips over 8 weeks |
| Decision rule | Commit to French audio tracks if French-market watch time rises at least 25 % |
| Budget and owner | $1,500 for professional subtitles; creator reviews titles; a freelance editor makes shorts |
Common mistakes
MistakeDefining a market as an entire language or continent.
InsteadDefine it by language, region and niche interest so decisions about dialect, timing and sponsors are clear.
MistakeAssuming home-market RPM applies everywhere.
InsteadCalculate a blended RPM and judge success by total revenue and other benefits.
MistakeChoosing markets on instinct alone.
InsteadUse a weighted scorecard to make assumptions explicit, then check them against data.
MistakeCommitting a large budget before testing.
InsteadRun a small, time-limited test with a primary metric and a decision rule.
MistakeRunning a test too small to detect anything.
InsteadEstimate the sample size needed or run the test longer.
Summary and key terms
- A creator's market combines language, region or culture, and niche interest.
- Top-down estimates multiply population by platform, language and interest shares; bottom-up evidence checks them.
- Blended RPM weights each market's RPM by its share of views and often falls as audiences broaden.
- A weighted scorecard compares markets on demand, value, ease, fit and complexity.
- Qualitative research reveals formats, vocabulary, gaps and sensitivities that numbers miss.
- A market test needs a hypothesis, a primary metric chosen in advance, an adequate sample and a decision rule.
- Most creators should choose one primary and at most one secondary market for the first year.
- Market
- A group of potential viewers sharing a language, region or culture and an interest in the niche.
- Top-down estimate
- A market size estimate that starts with a population and narrows it with assumed shares.
- Bottom-up evidence
- Data from searches, comparable creators and your own tests that checks top-down estimates.
- Blended RPM
- An average RPM weighted by each market's share of views.
- Weighted scorecard
- A table scoring options on weighted criteria to compare them explicitly.
- Competitive scan
- A structured review of leading creators in a niche and market.
- Market test
- A small, time-limited experiment to see whether a market responds.
- Primary metric
- The single measure chosen in advance to judge a test.
- Decision rule
- A pre-agreed threshold that determines what happens after a test.
- Cultural distance
- How different a market's culture is from the creator's, affecting how much adaptation is needed.
Practice problems
Work each problem on paper first, then reveal the answer to check.
Give an example of a well-defined market.
Show answer
Spanish-speaking home cooks in Mexico and the US who watch budget recipe content.
When is a country-first market definition better than language-first?
Show answer
When content depends on local conditions, such as finance, law, shopping or travel.
50 million users × 0.8 × 0.9 × 0.05. Reachable audience?
Show answer
1,800,000.
Views: 60 % at $5 RPM, 40 % at $2. Blended RPM?
Show answer
\( 0.6 \times 5 + 0.4 \times 2 = \$3.80 \).
Why can a falling blended RPM be acceptable?
Show answer
Total revenue and other benefits can still rise as the audience broadens.
Scores 4, 3, 5 with weights 0.5, 0.3, 0.2. Weighted score?
Show answer
\( 2.0 + 0.9 + 1.0 = 3.9 \).
Name two forms of qualitative market research.
Show answer
Competitive scans, comment mining, search research, interviews or cultural checks.
Why choose a primary metric before a test?
Show answer
To avoid interpreting whatever result arrives as success.
Why are views a weak metric for a language test?
Show answer
Platforms may show localized videos more widely without viewers staying.
How many new markets should most creators enter in year one?
Show answer
One primary and at most one secondary market.
Lesson quiz · 5 questions
Score 60% or more to complete this lesson.
Create a free account to save your progress, take quizzes and earn a certificate.