
CRE-440 · Lesson 4 of 12 · 31 min
Thinking in experiments
Creators experiment all the time, often without calling it that. They try a new thumbnail style, a shorter intro, a different posting day, a collaboration, a new format. Most of these tries are informal: the creator makes a change, looks at the numbers a few days later, and forms an impression. The trouble is that informal tries rarely produce reliable lessons. Views vary for many reasons, several things usually change at once, and the creator's expectations color how they read the result. Experimental thinking is a set of habits that turns these everyday tries into genuine learning. This lesson covers the mindset: hypotheses, variables, controls, predictions and the discipline of changing one thing at a time. Lesson 5 covers specific experiment designs and lesson 6 the statistics for judging results.
Why intuition is not enough
Experienced creators develop good instincts, and intuition is valuable for generating ideas. But intuition is poor at judging results, for several reasons.
- Noise: views and engagement fluctuate a great deal from video to video for reasons unrelated to any change you made, including topic, timing, competition and the algorithm's testing.
- Confirmation bias: people notice evidence that supports what they already believe. A creator who expects a new intro to work will remember the videos where it seemed to.
- Hindsight bias: after the fact, results seem obvious, so creators overestimate how much they knew in advance.
- Small samples: one or two videos are almost never enough to judge a change, because a single strong or weak topic can dominate the result.
Experiments do not replace judgment. They discipline it, by forcing you to state in advance what you expect and how you will know whether you were right.
The experiment loop
Good experimentation follows a loop that repeats: observe, form a hypothesis, predict, test, analyze and decide, then observe again.
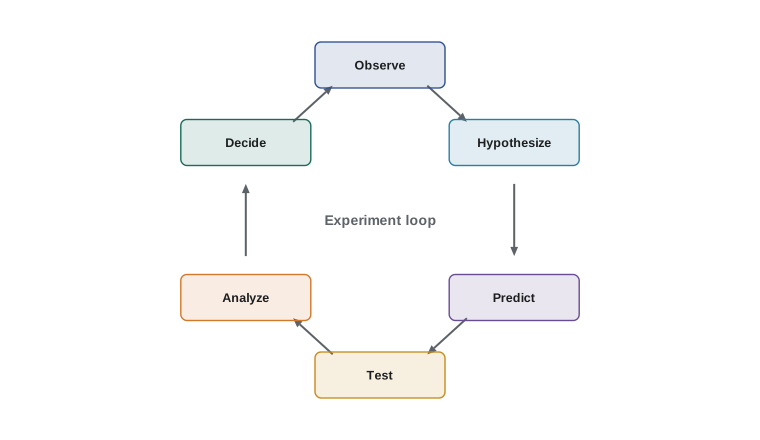
- Observe: notice a pattern, problem or opportunity in your data or audience feedback. For example, retention drops sharply in the first 30 seconds of most videos.
- Hypothesize: propose an explanation and a change. "Viewers leave early because the intro delays the payoff; showing the finished result in the first five seconds will keep more of them."
- Predict: state what you expect to see, in numbers, before you test. "Retention at 30 seconds will rise from 62 % to at least 67 %."
- Test: run the change under conditions that make the result interpretable.
- Analyze: compare the result with the prediction, accounting for noise.
- Decide: adopt, reject, refine or retest, and record what you learned.
Writing a testable hypothesis
A good hypothesis is specific, testable and based on a reason. A useful template is: Because [observation], we believe that [change] for [audience or content] will cause [measurable effect], which we will measure by [metric] over [period].
| Weak hypothesis | Testable hypothesis |
|---|---|
| Better thumbnails will help | Because our faces-only thumbnails get lower CTR from browse, adding the finished project to thumbnails will raise browse CTR by at least 0.5 percentage points over the next six uploads |
| Shorter videos are better | Because retention falls steeply after minute eight, cutting tutorials from 14 to 10 minutes will raise average percentage viewed from 38 % to 45 % without lowering total watch time per video |
| Posting more will grow us | Because returning viewers peak on upload days, moving from one to two uploads a week will raise monthly returning viewers by 15 % within two months, with no drop in average view duration |
Note that the stronger versions include a reason, a specific change, a measurable outcome, a threshold and a time frame. The third example also includes a guardrail: average view duration should not fall.
Variables
Experiments involve three kinds of variables.
- The independent variable is what you change on purpose, such as the thumbnail style or the intro length.
- The dependent variable is what you measure to see the effect, such as click-through rate or retention at 30 seconds.
- Confounding variables are other things that change at the same time and could explain the result, such as topic, posting day, season, a viral mention or a platform update.
The central challenge of creator experiments is controlling confounding variables. If you change your thumbnail style in the same month you switch to a more popular topic, you cannot tell which caused any change in clicks.
Worked problem
Spotting confounders
A creator switched to a new title style in December and saw views rise 35 % compared with November. In December the creator also published two holiday gift guides, and the platform introduced a new recommendation surface. List the possible explanations.
Show solution
- The new title style (the intended independent variable).
- Topic: gift guides have strong seasonal demand in December.
- Season: viewing time often rises during holidays.
- Platform change: a new recommendation surface may have increased impressions.
- Normal variation between months.
Answer: At least four explanations compete with the title style. The creator cannot credit the titles without a design that holds topic and timing steady, such as an A/B test of titles on the same videos.
Controls and comparison
A control is a comparison condition that shows what would have happened without the change. The strongest control is a randomized one, where the platform shows version A to some viewers and version B to others at the same time, so topic, timing and season affect both equally. When randomization is not possible, creators use weaker comparisons: similar videos before and after the change, a holdout set of videos left unchanged, or a different platform used as a baseline. Lesson 5 compares these designs.
One change at a time, and why sometimes not
The classic rule is to change only one thing at a time, so any effect can be attributed to it. For creators with limited output, testing one variable per experiment is usually wise. But there are two exceptions. First, when you are exploring a completely new format, you may deliberately change many things at once to see whether the new direction has promise at all, and then refine. Second, larger channels with the right tools can test combinations, such as two thumbnails crossed with two titles, in a factorial design. The key is to be clear about which kind of test you are running and what it can tell you.
Predictions and pre-commitment
Writing your prediction and decision rule before you test is one of the most powerful habits in experimentation. It protects against moving the goalposts after seeing results. A simple pre-commitment note records the hypothesis, the primary metric, the guardrail metrics, the minimum effect worth acting on, the duration or sample size, and what you will do in each case. For example: "If 30-second retention rises by 5 points or more with average view duration not falling, adopt the new intro for all videos. If it rises by less than 2 points, keep the old intro. Between 2 and 5 points, run four more videos."
Worked problem
A simple decision rule
A creator pre-commits: adopt the new intro if 30-second retention averages at least 66 % over six videos, compared with the 12-video baseline of 62 %. Results for six videos are 64, 69, 67, 65, 70 and 66 %. What is the decision?
Show solution
- Average: (64 + 69 + 67 + 65 + 70 + 66) ÷ 6 = 401 ÷ 6 ≈ 66.8 %.
- This meets the 66 % threshold set in advance.
- Five of six videos beat the 62 % baseline; one was below 66 %, which is normal variation.
Answer: Adopt the new intro, as the pre-committed rule says. Lesson 6 shows how to check whether a difference like this is likely to be more than noise.
Choosing what to test
Creators always have more ideas than time to test them. A simple way to prioritize is an ICE score: rate each idea from 1 to 10 for Impact (how much it could move your north star), Confidence (how sure you are it will work, based on evidence), and Ease (how cheap and quick it is to test), then multiply or average the three. Some teams use RICE, which adds Reach, the share of content or audience affected.
Worked problem
Prioritizing with ICE scores
Three ideas are scored for Impact, Confidence and Ease: new thumbnail style (6, 7, 9), a weekly livestream (8, 4, 3), and a stronger call to subscribe at the end of videos (4, 6, 10). Rank them by the average of the three scores.
Show solution
- Thumbnail style: (6 + 7 + 9) ÷ 3 ≈ 7.3.
- Weekly livestream: (8 + 4 + 3) ÷ 3 = 5.0.
- Call to subscribe: (4 + 6 + 10) ÷ 3 ≈ 6.7.
Answer: Test the thumbnail style first, then the call to subscribe. The livestream has high potential impact but low confidence and ease; it may suit a smaller pilot later.
Prioritizing this way keeps the backlog focused on tests that are both valuable and practical. The scores are judgments, not measurements, so revisit them as you learn.
Ethics and audience trust
Experiments involve real people, your audience. Most creator experiments, such as testing thumbnails or intro lengths, are low risk. But experiments should never deceive viewers in ways that harm them, such as misleading titles, fake giveaways or manipulative urgency. Tests involving surveys or personal data must follow privacy law, covered in lesson 8. A simple rule: if you would be uncomfortable explaining the experiment to your audience, do not run it.
Keeping an experiment log
Every experiment, successful or not, should be recorded: the date, hypothesis, design, prediction, results, decision and what you learned. Over time, the log becomes one of your most valuable assets. It stops you from retesting old ideas, shows patterns across experiments, and helps new team members understand why things are done the way they are. Failed experiments are as valuable as successes, because they rule out ideas and refine your understanding of your audience.
Small tests and big decisions
Not every decision deserves a formal experiment. Small, easily reversed choices, such as the color of a lower-third graphic, can simply be tried and changed if they seem wrong. Formal experiments are most valuable for decisions that are costly, hard to reverse or repeated many times, such as a thumbnail template used on every video, a change in upload schedule, or a new format that will take months to build. A useful rule is to match the rigor of the test to the size and reversibility of the decision.
It also helps to separate questions that experiments can answer from those they cannot. Experiments are good at comparing specific alternatives, such as two intros. They are poor at answering open questions such as "What should my channel be about?" For those, audience research and strategy work, covered in lessons 1, 8 and 10, come first, and experiments then test the options they produce.
Worked problem
Matching rigor to the decision
A creator considers three changes: a new end-card font, a switch from weekly to twice-weekly uploads, and a new thumbnail template for every future video. Rank them by how much testing rigor they deserve.
Show solution
- End-card font: small effect, easily reversed. Simply try it.
- Thumbnail template: used on every future video, so even a small effect accumulates; test with Test & Compare on several videos.
- Upload frequency: large effect on workload and possibly burnout, slow to judge; plan a careful switchback or a time-limited trial with guardrails.
Answer: Upload frequency deserves the most rigor, then the thumbnail template; the font change can be decided informally.
Common mistakes
MistakeJudging a change from one or two videos.
InsteadPlan enough videos or viewers to see past normal variation, and use the methods in lesson 6.
MistakeChanging several things at once and crediting one of them.
InsteadChange one variable at a time unless you deliberately run an exploratory or factorial test.
MistakeDeciding what counts as success after seeing the data.
InsteadWrite the prediction, primary metric and decision rule before you test.
MistakeIgnoring confounders such as topic, season and platform changes.
InsteadList likely confounders and use a design that controls for them.
MistakeNot recording failed experiments.
InsteadLog every experiment; failures rule out ideas and prevent retesting.
Summary and key terms
- Intuition generates ideas but judges results poorly because of noise, bias and small samples.
- The experiment loop is observe, hypothesize, predict, test, analyze and decide.
- Testable hypotheses include a reason, a specific change, a measurable effect, a threshold and a time frame.
- Independent variables are changed, dependent variables measured and confounders controlled.
- Controls show what would have happened without the change; randomized controls are strongest.
- Pre-committing to predictions and decision rules prevents moving the goalposts.
- ICE scores help prioritize tests, and an experiment log preserves learning.
- Hypothesis
- A specific, testable explanation and proposed change with an expected effect.
- Independent variable
- The factor deliberately changed in an experiment.
- Dependent variable
- The outcome measured to detect an effect.
- Confounding variable
- A factor that changes alongside the tested change and could explain the result.
- Control
- A comparison condition showing what happens without the change.
- Randomization
- Assigning viewers or items to conditions by chance so confounders affect each equally.
- Pre-commitment
- Recording predictions and decision rules before seeing results.
- Confirmation bias
- The tendency to notice evidence that supports existing beliefs.
- ICE score
- A prioritization score combining Impact, Confidence and Ease.
- Factorial design
- An experiment that tests combinations of two or more variables at once.
Practice problems
Work each problem on paper first, then reveal the answer to check.
List the six steps of the experiment loop.
Show answer
Observe, hypothesize, predict, test, analyze, decide.
Name two reasons intuition judges results poorly.
Show answer
Noise, confirmation bias, hindsight bias, small samples.
In a thumbnail test, what is the dependent variable?
Show answer
Usually click-through rate.
What is a confounding variable?
Show answer
Something else that changes at the same time and could explain the result.
Why is a randomized control strongest?
Show answer
Both versions face the same topic, timing and conditions, so differences come from the change.
What goes in a pre-commitment note?
Show answer
Hypothesis, primary and guardrail metrics, minimum effect, duration, and decisions for each outcome.
Six results average 58, 61, 60, 63, 59, 59. What is the mean?
Show answer
360 ÷ 6 = 60.
An idea scores Impact 9, Confidence 3, Ease 3. What is its average ICE score?
Show answer
5.
When might you change several things at once?
Show answer
When exploring a new direction, or in a deliberate factorial test.
Why log failed experiments?
Show answer
They rule out ideas and prevent repeating them.
Lesson quiz · 5 questions
Score 60% or more to complete this lesson.
Create a free account to save your progress, take quizzes and earn a certificate.