
CRE-440 · Lesson 12 of 12 · 32 min
Capstone: a one-year strategy with an experiment backlog
This capstone brings the whole course together. You will follow a fictional creator through building a one-year strategy, from vision and positioning to metrics, portfolio choices, an experiment backlog, a measurement plan, scenarios and a roadmap. Then you will build your own. The example is a composite, not a real channel, and the numbers are illustrative. The aim is not to copy its choices but to see how each tool from the earlier lessons fits into a single, coherent plan.
The creator: Priya's budget kitchen
Priya runs a cooking channel focused on affordable weeknight meals. After three years she has 62,000 subscribers on YouTube, a TikTok account with 40,000 followers, and an email list of 2,800 people. She works about 40 hours a week, with a part-time editor for 10 hours a week. Her monthly income is about $6,500: $3,200 from sponsorships, $1,900 from YouTube ads, $900 from affiliate links to kitchen tools and $500 from a small membership. Her analytics show a typical long video reaching 22,000 views in its first 28 days, average percentage viewed around 41 %, and about 9,000 returning viewers a month, each watching about 55 minutes.
Her concerns: growth has slowed, TikTok views swing wildly, sponsors increasingly ask about her email list, and she feels she works harder each year for the same results.
Step 1: vision and positioning
Priya starts with a three-year vision: "Help busy families in Canada and the US eat well for less, through tested, budget-friendly weeknight meals, earning a stable full-time income with a small team, without working weekends."
Her positioning statement: "For busy families who want healthy meals on a tight budget, Priya's kitchen is the cooking channel that delivers complete weeknight dinners for under a set cost per serving, with a printable grocery list, unlike recipe channels that focus on restaurant-style or expensive ingredients." Her chosen moats are trust (every recipe is tested and costed), an owned audience through the weekly meal-plan email, and a growing archive of evergreen, search-friendly recipes.
Step 2: north star and metric tree
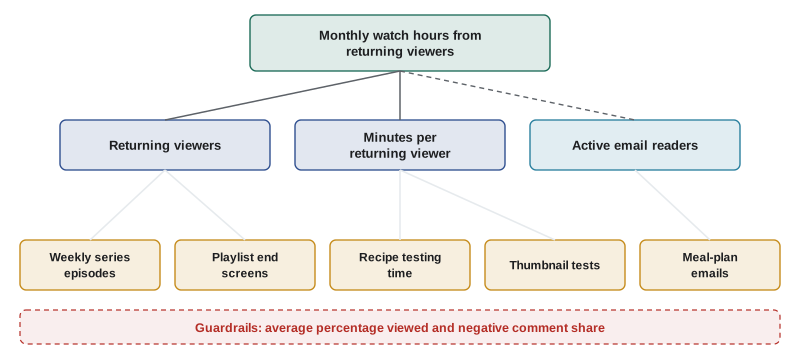
Priya chooses monthly watch hours from returning viewers as her north star, because it captures loyalty and depth and tends to lead sponsorship and membership income. She adds two supporting outputs, monthly returning viewers and active email readers, and two guardrails, average percentage viewed and the share of negative comments.
Worked problem
Setting a north-star baseline and target
Priya has 9,000 returning viewers a month, each watching about 55 minutes. She aims to raise returning viewers by 25 % and minutes per returning viewer by 8 % over the year. What are the baseline and target north-star values?
Show solution
- Baseline: 9,000 × 55 = 495,000 minutes = 8,250 hours.
- Target returning viewers: 9,000 × 1.25 = 11,250.
- Target minutes: 55 × 1.08 = 59.4.
- Target: 11,250 × 59.4 = 668,250 minutes ≈ 11,140 hours.
- Growth: 1.25 × 1.08 = 1.35, so 35 %.
Answer: The north star should rise from about 8,250 to about 11,140 hours a month, a 35 % gain, from two improvements that compound.
Step 3: yearly objectives and first-quarter OKRs
Priya sets two yearly objectives and breaks the first into first-quarter key results.
- Objective 1: Become the most trusted weeknight budget-cooking channel for families.
- Q1 key result: returning viewers from 9,000 to 9,900 a month.
- Q1 key result: average percentage viewed on new long videos from 41 % to 44 %.
- Q1 key result: active email readers from 1,900 to 2,500.
- Objective 2: Build a resilient income that does not depend on any single platform or sponsor.
- Year key result: no single sponsor above 25 % of annual income, and owned-channel income (membership and a planned meal-plan product) at 20 % of total.
Step 4: portfolio allocation
Priya reviews last year's hours and results. Long-form produced most of her returning watch time and income; TikTok brought new viewers but few became returning viewers; the email list was neglected. Applying the 70/20/10 idea and the lessons on diminishing returns, she plans weekly hours as follows.
| Activity | Hours per week | Role | Key metric |
|---|---|---|---|
| Long-form recipes (core) | 20 | Depth, trust, search | Returning watch hours |
| Short-form clips | 5 | Discovery | New viewers who later watch long-form |
| Weekly meal-plan email | 3 | Owned audience | Active readers |
| Sponsors and admin | 6 | Revenue and operations | Sponsor renewals |
| Experiments and research | 4 | Learning | Experiments completed |
| Buffer | 2 | Reliability | Weeks without overruns |
Her exploration bet for the year is a monthly "feed a family of four for a week" challenge series. She treats it as a bet with stage gates after three and eight episodes.
Worked problem
Expected value of the challenge series
Priya estimates a 30 % chance the challenge series becomes a signature format adding $1,500 a month in sponsorship, a 50 % chance it performs like normal videos, and a 20 % chance it underperforms, costing about $300 a month in lost output. What is the expected monthly value, and what does it imply for the first stage gate?
Show solution
- Success: 0.30 × $1,500 = $450.
- Neutral: $0.
- Underperform: 0.20 × (−$300) = −$60.
- Expected value: $450 − $60 = $390 a month.
Answer: About $390 a month, a worthwhile bet. At the first gate, after three episodes, Priya will check whether retention and returning viewers are above her median, and update her estimate as in lesson 11.
Step 5: the experiment backlog
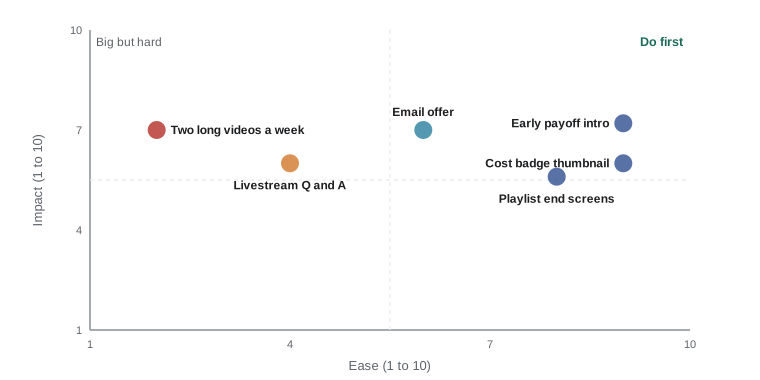
Priya lists ideas from her research, competitive review and analytics, and scores each with ICE (impact, confidence, ease, each from 1 to 10).
| Idea | Impact | Confidence | Ease | ICE average |
|---|---|---|---|---|
| Show the finished dish and cost per serving in the first 5 seconds | 7 | 7 | 9 | 7.7 |
| Thumbnail with cost-per-serving badge (Test & Compare) | 6 | 6 | 9 | 7.0 |
| Playlist end screens linking the weekly series | 6 | 7 | 8 | 7.0 |
| Email sign-up offer: free printable weekly plan | 7 | 6 | 6 | 6.3 |
| Weekly 20-minute livestream Q&A | 6 | 4 | 4 | 4.7 |
| Posting two long videos a week instead of one | 7 | 3 | 2 | 4.0 |
She commits to the top four in the first quarter and parks the rest for later review.
Worked problem
Checking a test can detect the effect she wants
Priya's typical click-through rate is 4.5 %. For the badge thumbnail test she wants to detect a 0.6-point improvement. Her new videos typically get about 70,000 impressions in the first two weeks. Can a two-thumbnail test on one video detect this?
Show solution
- Variance: 0.045 × 0.955 ≈ 0.043.
- Required impressions per version: 16 × 0.043 ÷ 0.006² = 0.688 ÷ 0.000036 ≈ 19,100.
- Available per version with two thumbnails: 70,000 ÷ 2 = 35,000.
Answer: Yes. About 19,000 impressions per version are needed and about 35,000 are available, so a single video should be enough for this effect size. A three-way test would leave about 23,000 per version, still sufficient.
Worked problem
Planning the intro holdout
For the intro experiment, Priya measures 30-second retention per video. Across her last 20 videos, the standard deviation is about 4 points. She wants to detect a 3-point improvement. How many videos per group does she need?
Show solution
- n ≈ 16 × 4² ÷ 3² = 16 × 16 ÷ 9 ≈ 28 videos per group.
Answer: About 28 per group, more than a year of weekly uploads. Priya decides instead to judge the intro using the retention curve within each video, which has thousands of viewers, by comparing 30-second retention for new-intro videos against her 20-video median, while watching for novelty effects and treating the result as strong evidence only if it holds for eight or more videos.
Step 6: the measurement plan
A measurement plan says what is tracked, how often and where. Priya's plan:
- Weekly: first-week views per new video against her 20-video median, click-through and 30-second retention, email open and click rates.
- Monthly: north star, returning viewers, average percentage viewed, comment theme counts from a sample of 300 comments, sponsor pipeline.
- Quarterly: OKR scores, cohort retention of new subscribers, share of voice on ten key recipe searches, platform dependence, experiment log review.
- Definitions: she records which metric definitions she uses, such as engaged views for Shorts, and notes any platform changes in her log.
- Privacy: survey and email data are collected with clear consent and purpose, stored securely, and follow the rules discussed in lesson 8.
Step 7: scenarios and pre-mortem
Worked problem
Downside scenario check
Priya's monthly costs, including her editor, are $4,800. In a downside scenario, sponsorship ($3,200) falls 40 %, ad revenue ($1,900) falls 25 %, and affiliates ($900) and membership ($500) are unchanged. What is downside income, and how many months of costs should her reserve cover?
Show solution
- Sponsorship: 0.6 × 3,200 = $1,920.
- Ads: 0.75 × 1,900 = $1,425.
- Total: 1,920 + 1,425 + 900 + 500 = $4,745.
- Monthly shortfall: 4,800 − 4,745 = $55.
Answer: The downside nearly breaks even, so a reserve of three to six months of costs, about $14,400 to $28,800, gives a comfortable cushion. She also lists the editor's hours as a cost she could temporarily reduce.
Her pre-mortem lists the main ways the year could fail: the challenge series takes too long to produce, the email offer attracts sign-ups who never open, a large sponsor leaves, and burnout during the holiday season. Each has a mitigation: a two-episode pilot before committing, measuring active readers rather than list size, a cap of 25 % income from any one sponsor, and booked time off in December.
Step 8: the roadmap
Priya's roadmap places the core weekly videos and meal-plan emails all year; the challenge series pilot in the first quarter with a decision gate at the end of it; a meal-plan product pre-sale in the second quarter, launching in the third only if pre-sales pass a set threshold; and a holiday budget-feast series in the fourth quarter, with lighter sponsor commitments. Each quarter ends with a review using the four questions from lesson 11.
Your capstone
Now build your own one-year strategy for a real or planned channel. Your submission should include:
- A three-year vision and a positioning statement, with one or two moats you will invest in.
- A north-star metric with a baseline, a target and a metric tree showing outputs, inputs and guardrails.
- Two yearly objectives and first-quarter OKRs with starting values and targets.
- A weekly time allocation and one exploration bet with stage gates and an expected-value estimate.
- An experiment backlog of at least six ideas scored with ICE, with briefs for the top three, including sample-size checks.
- A measurement plan listing weekly, monthly and quarterly metrics, definitions and privacy practices.
- Base, upside and downside scenarios, a pre-mortem with mitigations, and a one-year roadmap.
Keep it short enough to use: most good creator strategies fit on three to five pages. Revisit it at each quarterly review, and expect to change it as your experiments teach you more about your audience.
Common mistakes
MistakeBuilding a strategy that tries to do everything.
InsteadMake clear choices, including what you will not do this year.
MistakeSetting a north star without a baseline.
InsteadMeasure the starting value first so targets and progress are meaningful.
MistakeFilling the backlog with tests too small to detect anything.
InsteadCheck sample sizes and favor tests with enough traffic or large expected effects.
MistakeLeaving no buffer or exploration time.
InsteadReserve hours for buffer and for one or two deliberate bets.
MistakeWriting the strategy once and never revisiting it.
InsteadReview it quarterly and update it as evidence arrives.
Summary and key terms
- A one-year strategy links vision, positioning, metrics, portfolio choices, experiments and plans.
- The north star should have a baseline and target; compounding components can produce large gains.
- OKRs translate yearly objectives into quarterly measurable outcomes.
- Time allocation applies portfolio thinking, with a deliberate exploration bet and stage gates.
- An ICE-scored backlog and sample-size checks keep experiments valuable and feasible.
- A measurement plan defines what is tracked, how often, with consistent definitions and good privacy practice.
- Scenarios, pre-mortems, a roadmap and quarterly reviews make the strategy resilient and adaptive.
- Capstone
- A final project that applies the skills from a whole course.
- Measurement plan
- A document setting out which metrics are tracked, how often and with what definitions.
- Experiment backlog
- A prioritized list of experiment ideas waiting to be tested.
- Exploration bet
- A deliberate, higher-risk investment in a new format or platform.
- Reserve
- Cash set aside to cover costs during a downturn.
- Concentration cap
- A limit on the share of income from any single sponsor or platform.
- Decision gate
- A planned point at which evidence determines whether to continue a project.
- Pre-sale threshold
- A minimum level of advance sales required before building a product.
- Positioning statement
- A sentence describing audience, need, benefit and difference from alternatives.
- Compounding
- When improvements multiply together, producing a larger combined effect.
Practice problems
Work each problem on paper first, then reveal the answer to check.
8,000 returning viewers watch 50 minutes each. What is the north star in hours?
Show answer
About 6,667 hours.
Returning viewers rise 20 % and minutes rise 10 %. What is the combined growth?
Show answer
1.2 × 1.1 = 1.32, or 32 %.
Write one key result for an objective about owned audiences.
Show answer
For example: grow active email readers from 1,500 to 2,200 this quarter.
A bet has 25 % chance of +$2,000, 60 % of $0, 15 % of −$400. What is its expected value?
Show answer
$500 − $60 = $440.
ICE scores 8, 5, 8. What is the average?
Show answer
7.0.
CTR 4 %; detect 0.8 points. Impressions per version?
Show answer
16 × 0.0384 ÷ 0.000064 ≈ 9,600.
SD 5 points; detect 5 points. Videos per group?
Show answer
16.
Name two items in a measurement plan.
Show answer
Metrics with frequencies, definitions, data sources, privacy practices.
Costs $5,000 a month; reserve of four months. How much?
Show answer
$20,000.
Why review the strategy quarterly?
Show answer
To score progress, apply experiment results and adjust choices.
Lesson quiz · 5 questions
Score 60% or more to complete this lesson.
Create a free account to save your progress, take quizzes and earn a certificate.