
CRE-310 · Lesson 11 of 12 · 30 min
Reporting results and winning renewals
Posting the content is not the end of a partnership. Brands need results to justify their spending, and the way you report those results strongly affects whether they hire you again. Repeat business is the most profitable kind: no pitching, faster approvals, better understanding of the brand and often higher fees. This lesson covers what to measure, how to calculate the metrics brands care about, how to build a clear report, how to interpret results honestly, and how to turn a single campaign into a renewal or long-term relationship.
What brands want to know
A brand manager reporting to their boss needs to answer a few questions: Did the content run as agreed? How many people saw it? How did they respond? Did it drive the action we wanted? Was it good value compared with alternatives? Your report should answer these questions directly, using the KPIs agreed at the start of the campaign. Lesson 2 introduced the main metrics; here you will apply them to real reporting.
Collecting the data
Gather data from several sources:
- Platform analytics: reach, impressions, views, watch time, retention, likes, comments, shares, saves, profile visits and link clicks.
- Link and code tracking: clicks on tracked links (often using UTM parameters added to URLs), discount code redemptions and affiliate dashboards.
- Brand data: sales, sign-ups or installs attributed to your content, which the brand may share.
- Qualitative feedback: notable comments, questions about the product, messages from followers and examples of audience sentiment.
Take screenshots of analytics at agreed intervals, such as 7 and 30 days after posting, because platforms may change how they display historical data and brands often want proof. Note the date and time of each screenshot.
UTM parameters are tags added to the end of a web address, such as utm_source, utm_medium and utm_campaign, that let the brand's web analytics identify where visitors came from. Brands usually provide tagged links; check that they work before posting.
Calculating key metrics
Present the core metrics with clear definitions. The most common calculations are:
Be careful to distinguish ROAS, which compares revenue with cost, from ROI, which compares profit with cost. A campaign with a ROAS of 3 (three dollars of revenue per dollar spent) may still lose money if the product's margins are low.
Worked problem
A full campaign calculation
A brand paid $3,000 for a sponsored video. It received 120,000 impressions, 2,400 link clicks and 96 purchases with an average order value of $75. The brand's gross margin is 60 %. Calculate CPM, CTR, CPC, conversion rate, CPA, ROAS and ROI.
Show solution
- CPM: $3,000 ÷ 120,000 × 1,000 = $25; CTR: 2,400 ÷ 120,000 = 2 %; CPC: $3,000 ÷ 2,400 = $1.25.
- Conversion rate: 96 ÷ 2,400 = 4 %; CPA: $3,000 ÷ 96 = $31.25.
- Revenue: 96 × $75 = $7,200; ROAS: 7,200 ÷ 3,000 = 2.4; gross profit: $7,200 × 0.60 = $4,320; ROI: ($4,320 − $3,000) ÷ $3,000 = 44 %.
Answer: CPM $25, CTR 2 %, CPC $1.25, conversion rate 4 %, CPA $31.25, ROAS 2.4 and ROI 44 % on first purchases.
Many products are bought repeatedly, so a customer's lifetime value can far exceed the first order. A subscription brand, for example, might value a new customer at several times the first payment. If the brand shares its customer lifetime value, you can show the campaign's longer-term return, which often makes creator campaigns look much stronger.
Worked problem
Return with lifetime value
Using the campaign above, suppose the brand estimates each new customer is worth $180 in gross profit over their lifetime. What is the lifetime ROI?
Show solution
- Lifetime gross profit: 96 × $180 = $17,280.
- Lifetime ROI: ($17,280 − $3,000) ÷ $3,000 ≈ 4.76, or 476 %.
- The campaign looks far stronger once repeat purchases are counted.
Answer: A lifetime ROI of about 476 %, compared with 44 % on first purchases alone.
Attribution limits
Tracked links and codes undercount the effect of creator content. People may see a video, then search for the product later, buy in a store, or buy on a different device. Discount codes can leak to coupon websites and be used by people who never saw your content. Brands know attribution is imperfect, and many use methods such as post-campaign surveys ("how did you hear about us?"), brand lift studies or comparisons of sales in periods with and without creator activity.
In your report, be honest about these limits rather than overstating results. You can point to supporting evidence of wider impact, such as a rise in branded search, comments from people saying they bought the product, or increased followers on the brand's account, while being clear about what is directly measured and what is indicative.
Building the report
A good campaign report is short, visual and organized around the agreed objectives. A typical structure:
- Summary: two or three sentences on what was delivered and the headline results against KPIs.
- Deliverables: what was posted, where and when, with links and screenshots.
- Reach and engagement: key metrics compared with your benchmarks or the campaign targets.
- Actions: clicks, code uses, conversions and costs per action.
- Audience response: notable comments, questions and sentiment.
- Insights: what worked, what did not and why.
- Recommendations: ideas for the next campaign.
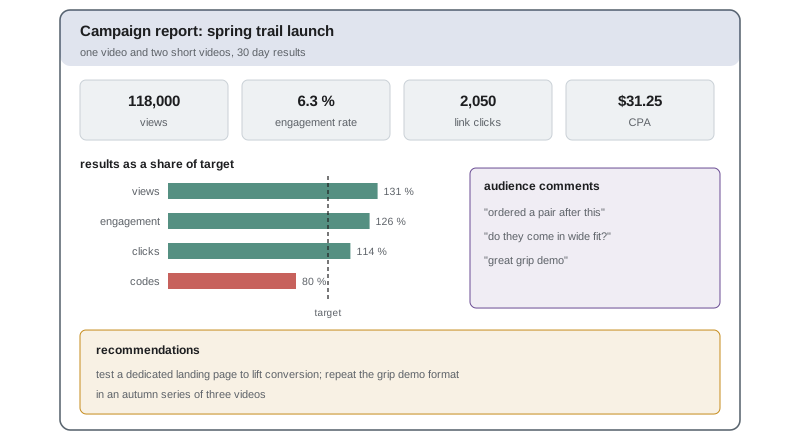
| Metric | Target | Result | Status |
|---|---|---|---|
| Views (30 days) | 90,000 | 118,000 | Above target |
| Engagement rate (by views) | 5 % | 6.3 % | Above target |
| Link clicks | 1,800 | 2,050 | Above target |
| Code redemptions | 120 | 96 | Below target |
| CPA | $25 | $31.25 | Below target |
Send the report on time, usually within a week or two of the agreed measurement point. Even if the brand does not ask, a short report sets you apart from most creators and makes renewals more likely.
Interpreting results honestly
Not every campaign hits its targets. When results fall short, explain possible reasons and what you learned. Was the timing poor? Did the product fit less well than expected? Did the code leak, or was the offer weak? Was the link hard to find? Brands respect creators who analyze results honestly and propose improvements; they lose trust in creators who hide or spin poor results. If a campaign over-delivers, note what drove the success so it can be repeated.
Worked problem
Diagnosing a shortfall
A campaign hit its target of 2,000 clicks but delivered only 50 sales against a target of 100. The landing page conversion rate for the brand's other traffic is 5 %. What does this suggest?
Show solution
- Campaign conversion rate: 50 ÷ 2,000 = 2.5 %.
- Brand's usual landing page rate: 5 %, double the campaign's.
- The content drove interest (clicks on target), but visitors converted poorly, which may point to a mismatch between the content's promise and the landing page, price or offer, or to an audience less ready to buy.
Answer: The click target was met but the 2.5 % conversion rate is half the brand's norm, suggesting the issue lies after the click; the report should propose testing a dedicated landing page or stronger offer.
From campaign to renewal
The best time to discuss the next campaign is when the current one is fresh and successful. In your report or follow-up, suggest a next step: a seasonal campaign, a series, a longer-term ambassadorship or a different format that builds on what worked. Make it easy for the brand to say yes by proposing specific deliverables, dates and pricing.
Renewals are also a natural moment to adjust prices. If your audience has grown or results were strong, it is reasonable to increase your fee, explaining the reasons with data. Many creators raise rates modestly for returning clients, balancing growth with loyalty, and offer a better rate for longer commitments.
Worked problem
Pricing a renewal
A creator charged $2,000 for a campaign six months ago. Median views have risen from 80,000 to 100,000. The creator wants to keep the same effective CPM but offer returning clients a 5 % loyalty discount. What should the renewal fee be?
Show solution
- Previous effective CPM: $2,000 ÷ 80 = $25.
- New fee at the same CPM: 100 × $25 = $2,500.
- With a 5 % loyalty discount: $2,500 × 0.95 = $2,375.
Answer: About $2,375, an increase justified by growth while rewarding loyalty.
Maintaining relationships between campaigns
Keep in touch with brand contacts between campaigns without being pushy. Share relevant results, such as a strong organic post featuring their product, tag them when you genuinely use their product, and send occasional updates on your audience growth or upcoming content that could fit their plans. Remember key dates in their calendar and pitch early for seasonal moments. Small gestures, like a thank-you message after a campaign, build goodwill.
Keep good records of every partnership: contacts, dates, fees, deliverables, results, feedback and renewal discussions. These records help with pricing, forecasting, taxes and future pitches.
Handling problems after delivery
Sometimes problems arise after posting: a product recall, negative comments about the brand, a disclosure issue or a disagreement about results. Respond quickly and calmly, communicate with the brand before acting publicly, and follow the contract. If a product turns out to be unsafe or misleading, your first obligation is to your audience: tell them honestly, even if it ends the relationship.
Benchmarks and context
Numbers mean more with context. Compare campaign results with your own averages for similar content, with the targets agreed with the brand, and, where available, with the brand's benchmarks for other creators or channels. A sponsored video that received 15 % fewer views than your median is not necessarily a failure if it drove twice the usual number of clicks. Explain such trade-offs in your report so the brand sees the full picture.
Reporting for different objectives
Tailor reports to the campaign objective. For an awareness campaign, emphasize reach, views, completion rates and audience demographics. For a consideration campaign, emphasize engagement, saves, shares, comments with purchase intent and clicks. For a conversion campaign, emphasize clicks, conversions, CPA and revenue. For a content-focused deal, report on the assets delivered and, if the brand shares data, how they performed in its ads.
Asking for brand-side data
Brands often have data you cannot see, such as sales, sign-ups, ad performance of whitelisted content and lifetime value. Ask politely whether they can share key results, explaining that it helps you improve future campaigns. Some brands will share; others will not for confidentiality reasons. When they do, it gives you powerful case-study material, with permission, for future pitches.
Testimonials and case studies
After a successful campaign, ask the brand contact for a short testimonial you can use in your media kit, and permission to share headline results. A two-sentence quote from a satisfied brand manager is persuasive social proof for future partners.
Timing the report
Agree in advance when results will be measured, such as 7 and 30 days after posting, and stick to those points so reports are consistent across campaigns. Most views on short-form content arrive in the first few days, while long-form videos and search-driven content may keep gaining views for months. If content continues to perform well after the report, a short update later can strengthen the case for renewal.
Reports as sales tools
A well-designed report is also a sales document. With permission, anonymized or summarized versions of strong reports become case studies for your media kit and pitches. Over time, a library of reports shows prospective partners a consistent record of delivery, which is more persuasive than any single metric. Keep a master spreadsheet of campaign results so you can quote averages across partnerships, such as your typical click-through rate or CPA in a category.
Common mistakes
MistakeNot reporting unless the brand asks.
InsteadSend a short report on time for every campaign.
MistakeConfusing ROAS with ROI.
InsteadROAS uses revenue; ROI uses profit.
MistakeOverstating results from imperfect tracking.
InsteadSeparate measured results from indicative evidence.
MistakeHiding missed targets.
InsteadExplain shortfalls and propose improvements.
MistakeWaiting for the brand to propose a renewal.
InsteadSuggest a specific next campaign while results are fresh.
Summary and key terms
- Reports should answer whether content ran, who saw it, how they responded and whether it delivered value.
- Collect platform analytics, tracking data, brand data and qualitative feedback.
- Key metrics include CPM, CTR, CPC, conversion rate, CPA, ROAS and ROI.
- Lifetime value can change how a campaign's return looks.
- Attribution is imperfect; report honestly what is measured.
- A short visual report against targets builds trust.
- Propose renewals while results are fresh and price them from data.
- CTR
- Click-through rate: clicks as a share of impressions.
- CPC
- Cost per click.
- Conversion rate
- Conversions as a share of clicks.
- ROI
- Return on investment: profit minus cost, divided by cost.
- Lifetime value
- The total profit a customer brings over time.
- UTM parameters
- Tags in web addresses that identify traffic sources.
- Attribution
- Assigning conversions to marketing activities.
- Brand lift
- Measured change in awareness or perception from a campaign.
- Code leakage
- Discount codes spreading beyond the intended audience.
- Renewal
- A repeat partnership with the same brand.
Practice problems
Work each problem on paper first, then reveal the answer to check.
CPM for $1,500 and 60,000 impressions?
Show answer
$25.
CTR for 900 clicks on 45,000 impressions?
Show answer
2 %.
CPA for $2,400 and 80 conversions?
Show answer
$30.
ROAS for $6,000 revenue on $2,000 cost?
Show answer
3.
ROI for $2,500 profit on $2,000 cost?
Show answer
25 %.
Why do tracked codes undercount impact?
Show answer
People buy later, elsewhere or on other devices.
What are UTM parameters?
Show answer
URL tags identifying traffic sources.
Name four sections of a campaign report.
Show answer
Summary, deliverables, reach, actions, response, insights, recommendations.
Renewal fee at $20 CPM for 90,000 views with 10 % loyalty discount?
Show answer
$1,620.
When is the best time to propose a renewal?
Show answer
When results are fresh, in or after the report.
Lesson quiz · 5 questions
Score 60% or more to complete this lesson.
Create a free account to save your progress, take quizzes and earn a certificate.