
CRE-202 · Lesson 4 of 12 · 27 min
Engagement metrics and what they mean
Engagement metrics count the actions people take on content: likes, comments, shares, saves, follows, replies, reposts, clicks and more. They signal interest and, on many platforms, feed recommendation systems (CRE-201). They are also the numbers brands look at most closely and the most frequently misunderstood. Not all engagements mean the same thing, and engagement rates can be calculated in many ways. This lesson covers the meaning of different actions, engagement rate formulas and their uses, weighting engagements, comment quality, shares and saves as signals of value, follows and unfollows, link clicks, engagement over time and by format, and the problem of fake or inflated engagement.
What different actions mean
Each kind of engagement reflects a different level of effort and intent:
- Likes and reactions: low effort, indicating mild approval; abundant and the weakest signal of value on their own.
- Comments: more effort, indicating that content prompted a thought, question or emotion; quality and content of comments matter (below).
- Shares and sends: people passing content to friends or posting it to their own audience, suggesting it is valuable, funny or meaningful enough to associate with themselves. Private sends through messages have become one of the strongest signals on several platforms.
- Saves and bookmarks: people intending to return, common for tutorials, recipes, tips and references.
- Follows and subscriptions: a commitment to see more, the clearest sign that content built a relationship.
- Clicks: on links, profiles, products or calls to action, indicating intent to go further.
- Negative actions: hides, "not interested", unfollows, reports and skips, which indicate dissatisfaction.
Interpreting engagement means looking at which actions occurred, not just how many.
| Action | Effort | Typical meaning | Content that earns it |
|---|---|---|---|
| Like | Very low | Mild approval | Most content |
| Comment | Medium | Prompted a reaction or question | Opinions, questions, stories |
| Share / send | Medium | Worth passing on | Humor, relatable, useful, surprising |
| Save | Low to medium | Worth returning to | Tutorials, recipes, tips, lists |
| Follow | Medium | Wants more | Consistent value, clear identity |
| Click | Medium to high | Intent to go further | Strong call to action, clear benefit |
Engagement rate formulas
Engagement rate expresses engagements as a percentage of some audience measure. Common versions include:
Engagement rate by reach (or by views) measures how compelling a piece of content was to the people who saw it, which is best for comparing posts. Engagement rate by followers measures how active the audience is relative to account size, often used by brands to compare creators, though it can exceed 100 % for viral posts that reach far beyond followers. Engagement rates generally decline as accounts grow, because larger audiences include more passive followers, so comparing a 5,000-follower account with a 500,000-follower account on engagement rate alone is unfair. Always define which engagements are included and which denominator is used.
Weighting engagements
Because actions differ in value, some creators and agencies use weighted engagement scores, giving more weight to shares, saves and comments than to likes. For example, a creator might count a like as 1, a comment as 3, a save as 3 and a share as 5. Weighted scores are arbitrary unless they reflect real value to the creator's goals, and they should not be presented to brands as standard metrics without explanation. A simpler and more transparent approach is to report each action separately per 1,000 reach and to highlight the actions that matter most for the goal, such as saves for a recipe account or shares for a comedy account.
Worked problem
Comparing two posts by action type
Post A reached 20,000 accounts with 1,600 likes, 40 comments, 60 shares and 100 saves. Post B reached 18,000 accounts with 900 likes, 90 comments, 300 shares and 450 saves. Which post better served a creator whose goal is useful, shareable education?
Show solution
- Per 1,000 reach, A: likes 80, comments 2, shares 3, saves 5.
- Per 1,000 reach, B: likes 50, comments 5, shares 16.7, saves 25.
- A has more likes, but B has five times the saves and shares per person reached.
- For useful, shareable education, saves and shares matter more than likes.
Answer: Post B: far more saves and shares per 1,000 reached, the actions that reflect educational value.
Comment quality
Comment counts can mislead. A post that asks viewers to comment a single word to receive a link may generate thousands of low-value comments, while a thoughtful essay may generate fewer but far richer replies. Reading comments reveals what people found interesting, confusing, inspiring or objectionable, what they want next, and how they describe the content in their own words, which is useful for titles and search (CRE-201 Lesson 8). Useful practices include reading all comments on recent posts, at least for smaller channels; tagging recurring themes, such as questions, requests, praise and criticism; tracking the share of comments from returning community members; and noting conversation between viewers, a sign of community. Some platforms offer comment sentiment or topic summaries, but these are approximations. Comment volume driven by controversy or anger may boost distribution in the short term but damage trust and wellbeing.
Shares and saves as signals of value
Shares and saves are often the best indicators that content provided real value. Shares extend reach to new people through trusted connections, so content with high share rates often grows audiences efficiently. Saves indicate that people plan to return, which suits evergreen content. Tracking shares and saves per 1,000 reach by topic and format reveals which content people find most useful or meaningful. On some platforms, private sends through direct messages are reported separately from public reposts; both matter. Content designed only to provoke shares, such as tagging prompts or chain messages, tends to wear thin with audiences and may be demoted as engagement bait.
Follows, unfollows and follower growth
Follower growth is one of the most watched numbers, but net growth hides two flows: new follows and unfollows. A day with 500 new follows and 450 unfollows looks like slow growth but signals high churn. Many dashboards report follows from each post, allowing calculation of follows per 1,000 reach, a useful measure of how well content converts viewers into followers. Unfollows after particular posts can reveal content that disappointed the existing audience, such as a sudden change in topic or a heavily sponsored post. Follower growth rate, net new followers divided by starting followers over a period, allows comparisons across accounts and time.
Link clicks and calls to action
Link clicks measure whether content moves people beyond the platform: to a website, a shop, a newsletter or another platform. Click-through rate for links, clicks divided by views or reach, depends heavily on placement (link in bio, link sticker, pinned comment, description, or in-post link where allowed) and on the clarity and appeal of the call to action. Using tracked links, with UTM parameters or link-shortening services that count clicks, shows which posts and platforms drive traffic (Lesson 6). Because many platforms limit or deprioritize external links, clicks can be low even for strong content; for many creators, the relevant measure is clicks per post that included a call to action, compared over time.
Engagement over time and by format
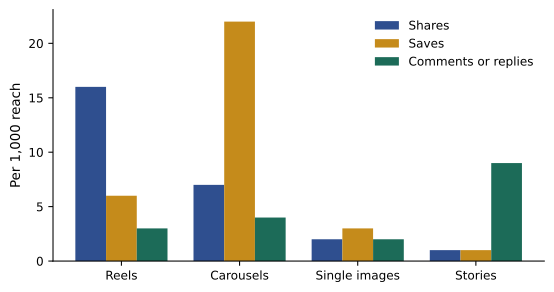
Engagement accumulates on similar timescales to views, mostly in the first days for feed content. Comparing engagement rates across formats, such as Reels, carousels, single images, stories, Shorts and long videos, shows which formats generate which kinds of engagement: carousels often attract saves, short videos attract shares and follows, stories attract replies and link clicks, long videos attract comments and subscriptions. Comparisons should use consistent windows and denominators. Tracking engagement rates over months shows whether audience interest is rising or declining, which is more informative than any single post.
Fake and inflated engagement
Engagement can be inflated by bought likes and followers, bot comments, engagement pods (groups who agree to engage with each other's posts), giveaways that require following many accounts, and engagement bait. Platforms prohibit inauthentic engagement and remove fake accounts, which can cause sudden drops in follower counts. Brands and agencies use tools to detect suspicious patterns: sudden follower spikes without matching content performance, very high like counts with few comments, comments that are generic or irrelevant, and audiences concentrated in unexpected countries. Inflated engagement misleads brands, which may breach contracts and consumer protection rules, and it corrupts your own data, making decisions harder. Genuine, modest engagement is far more valuable than inflated numbers.
Engagement on comments and replies
Replies to comments, by the creator and by other viewers, deepen engagement and community. Many creators track the share of comments that receive a reply and the number of conversation threads, since active replies encourage more comments and signal an engaged community to both viewers and platforms. Pinned comments, hearted comments and replies from the creator in the first hour can shape the tone of the discussion. These activities take time, so creators often focus replies on the first hours after posting and on thoughtful or question comments. Moderation, removing spam, abuse and harmful content, also affects engagement quality (CRE-301).
Engagement benchmarks by account size
Published benchmarks commonly show engagement rates falling as follower counts rise, with small accounts sometimes showing rates several times higher than large ones. These figures vary by platform, niche, method and year and should be used only as rough context. More useful is tracking your own engagement rate over time as the account grows, and comparing with a small set of similar creators of comparable size in the same niche, using the same definition. A falling engagement rate during rapid growth is normal; a falling rate with flat follower counts may indicate declining audience interest.
Interpreting negative feedback
Some platforms report negative signals to creators, such as "not interested" selections, unfollows after a post, hides or skip rates; others report them only indirectly. Where available, these signals are as informative as positive engagement. A post with high likes but unusually high unfollows may have pleased new viewers while alienating existing followers. Negative comments are not always negative signals: thoughtful disagreement can indicate content that matters to people. Persistent negative feedback on certain topics or formats suggests a mismatch with the audience's expectations.
Worked problem
Follows per 1,000 reach by pillar
Over a month, a creator's tutorials reached 120,000 accounts and gained 600 follows; lifestyle posts reached 200,000 and gained 400 follows; and collaborations reached 80,000 and gained 560 follows. Which pillar converts viewers into followers best?
Show solution
- Tutorials: 600 ÷ 120,000 × 1,000 = 5 follows per 1,000 reach.
- Lifestyle: 400 ÷ 200,000 × 1,000 = 2.
- Collaborations: 560 ÷ 80,000 × 1,000 = 7.
Answer: Collaborations convert best (7 per 1,000), then tutorials (5), then lifestyle posts (2).
Engagement and brand partnerships
Brands often screen creators by engagement rate, sometimes with crude thresholds. Creators can help by reporting engagement with clear definitions, by format and by platform, and by highlighting the actions that matter to a campaign: saves and shares for consideration, link clicks for conversion. Explaining why engagement rates differ between formats, and between organic and sponsored posts, helps brands set realistic expectations (Lesson 11).
Engagement velocity
Engagement velocity, the rate at which engagement accumulates in the first hour or day after posting, is sometimes used as an early indicator of how a post will perform. A post that gathers comments and shares quickly may be tested with wider audiences sooner on some platforms. Velocity is useful for comparing posts at the same early time point, such as engagements per 1,000 reach after two hours, but should not drive anxious checking. Recording a single early snapshot for each post, alongside the 7-day result, shows how well early performance predicts final performance for your account.
In the end, engagement metrics are best read as conversations with an audience: each like, save, share and comment is a small message about what people valued, and the patterns across many posts are what reveal a creator's real strengths.
Common mistakes
MistakeCounting all engagements as equal.
InsteadLook at which actions occurred and why.
MistakeComparing engagement rates without stating denominators.
InsteadDefine engagements and denominator every time.
MistakeEquating many comments with value.
InsteadRead comments for quality and themes.
MistakeWatching only net follower growth.
InsteadTrack follows and unfollows separately.
MistakeBuying or trading engagement.
InsteadBuild genuine engagement and keep data clean.
Summary and key terms
- Likes, comments, shares, saves, follows and clicks reflect different intents.
- Engagement rate by reach compares content; by followers compares accounts.
- Weighted scores should reflect real goals and be explained.
- Comment quality matters more than count.
- Shares and saves often indicate real value.
- Track follows and unfollows, and clicks with tracked links.
- Avoid and detect fake or inflated engagement.
- Engagement
- Action taken on content.
- Engagement rate
- Engagements as a percentage of an audience measure.
- Share
- Passing content to others.
- Send
- Sharing content privately in messages.
- Save
- Bookmarking content to return to.
- Weighted engagement
- Score giving different actions different values.
- Churn
- Loss of followers through unfollows.
- Follower growth rate
- Net change in followers relative to the start.
- Engagement pod
- Group that engages with each other's posts.
- Engagement bait
- Content that asks for engagement artificially.
Practice problems
Work each problem on paper first, then reveal the answer to check.
Which action indicates intent to return?
Show answer
A save.
ER by reach for 600 engagements on 24,000 reach?
Show answer
2.5 %.
Why can ER by followers exceed 100 %?
Show answer
Viral posts reach far beyond followers.
Why do engagement rates fall as accounts grow?
Show answer
Larger audiences include more passive followers.
Saves per 1,000 reach for 90 saves on 15,000 reach?
Show answer
6.
Why read comments rather than count them?
Show answer
To learn what people think and want.
Growth rate from 20,000 to 23,000 followers?
Show answer
15 %.
What do UTM parameters help track?
Show answer
Which posts drive link clicks and traffic.
Which format often earns saves?
Show answer
Carousels.
Name two signs of fake engagement.
Show answer
Follower spikes, many likes with few comments, generic comments, odd countries.
Lesson quiz · 5 questions
Score 60% or more to complete this lesson.
Create a free account to save your progress, take quizzes and earn a certificate.