
CRE-202 · Lesson 10 of 12 · 28 min
Experiments and A/B tests
Analytics describe what happened; experiments help explain why. By changing one thing deliberately and comparing results, creators can learn whether a new thumbnail style, a different hook, a shorter length or a new posting time actually makes a difference, rather than guessing from patterns that may be coincidence. CRE-201 discussed why platform myths spread and how to design simple tests; this lesson goes deeper into the statistics and practice of experiments: hypotheses and variables, built-in A/B testing tools, comparing proportions, confidence intervals, sample size, noise and significance, sequential testing across posts, and common pitfalls.
Hypotheses and variables
An experiment starts with a hypothesis: a specific, testable statement such as "Opening tutorials by showing the finished result in the first 3 seconds will increase 30-second retention compared with opening with an introduction." The independent variable is what you change (the opening); the dependent variable is what you measure (30-second retention); controlled variables are things you keep the same (topic type, length, posting time, thumbnail style). A good hypothesis predicts both the direction and the metric, and explains why the change should matter. Testing one change at a time makes results interpretable; changing hook, length and thumbnail together makes it impossible to know which mattered.
Built-in A/B testing tools
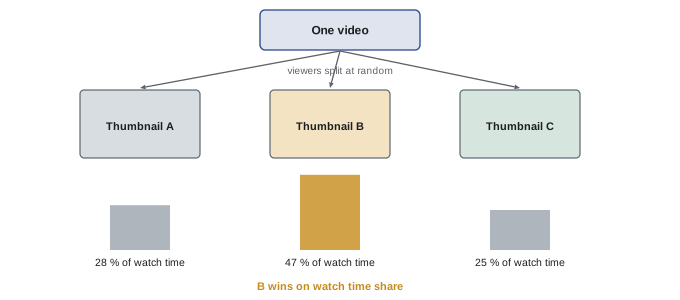
Some platforms provide built-in tests that show different versions to different viewers at the same time, the most reliable kind of comparison. YouTube's Test and Compare lets creators upload up to three thumbnails, and on eligible channels titles, for a video; YouTube shows them to viewers over a period and reports which version earned the greatest share of watch time, rather than simply the most clicks, so that misleading packaging does not win. Instagram's trial reels, discussed in CRE-201, show a Reel to non-followers first, letting creators test ideas before showing them to followers. Email platforms let creators test subject lines on part of a list before sending the winner to the rest. Using built-in tools where they exist avoids many of the problems of comparing different posts at different times.
Comparing proportions
Many creator metrics are proportions: the share of impressions that became clicks, the share of viewers still watching at 30 seconds, the share of recipients who opened an email. When comparing two versions, the observed difference includes random variation: even identical versions shown to different people produce slightly different results. The standard error of a proportion \(p\) measured on \(n\) people indicates how much it would vary by chance:
A rough 95 % confidence interval is the observed proportion plus or minus about two standard errors. If the intervals for two versions overlap heavily, the difference may be due to chance.
Confidence intervals in practice
Worked problem
Is the new subject line better?
A creator tests two newsletter subject lines, each sent to 2,000 subscribers. Version A is opened by 760 people (38 %); version B by 840 (42 %). Is B clearly better?
Show solution
- SE for A: \(\sqrt{0.38 \times 0.62 / 2000} \approx 0.0109\), so the 95 % interval is about 38 % ± 2.1 %, from 35.9 % to 40.1 %.
- SE for B: \(\sqrt{0.42 \times 0.58 / 2000} \approx 0.0110\), so about 42 % ± 2.2 %, from 39.8 % to 44.2 %.
- The standard error of the difference is \(\sqrt{0.0109^2 + 0.0110^2} \approx 0.0155\); the difference of 4 points is about 2.6 standard errors.
- A difference of more than about 2 standard errors is unlikely to be chance alone, so B is probably better, by roughly 1 to 7 percentage points.
Answer: Yes, B is probably better: the 4-point difference is about 2.6 standard errors, with a plausible true improvement of about 1 to 7 points.
The same approach applies to click-through rates and retention percentages, although platform metrics often include repeat viewers and other complications, so treat these calculations as approximate guides rather than exact tests.
Sample size
Small samples produce noisy results. The number of people needed to detect a difference reliably depends on the baseline rate and the size of the difference: detecting a change from 5 % to 6 % click-through requires far more impressions than detecting a change from 5 % to 10 %. A rough rule for comparing two proportions with 95 % confidence and good power (80 %) is:
where \(p\) is the baseline rate and \(\Delta\) the difference you want to detect. For a baseline of 5 % and a difference of 1 percentage point, \(n \approx 16 \times 0.05 \times 0.95 / 0.0001 = 7{,}600\) impressions per version; for a difference of 5 points, only about 300. Small channels therefore can only detect large effects, and should focus tests on changes likely to matter a lot.
| Baseline rate | Difference to detect | Approximate sample per version |
|---|---|---|
| 5 % | 1 point (to 6 %) | About 7,600 |
| 5 % | 2 points (to 7 %) | About 1,900 |
| 5 % | 5 points (to 10 %) | About 300 |
| 40 % | 2 points (to 42 %) | About 9,600 |
| 40 % | 5 points (to 45 %) | About 1,540 |
Noise and statistical significance
A result is described as statistically significant when it is unlikely to have occurred by chance if there were no real difference, conventionally with less than a 5 % probability. Significance does not mean the difference is large or important: with enough data, tiny differences become significant. Equally, a non-significant result does not prove there is no difference; the test may have been too small. Report the size of the effect and its uncertainty, not just whether it was significant. Be wary of checking results repeatedly and stopping as soon as one version looks ahead, a practice called peeking, which greatly increases false positives. Decide the sample size or duration in advance, and stop then.
Sequential tests across posts
Where no built-in tool exists, creators test by comparing posts published at different times, such as alternating two hook styles over several weeks. This is weaker than a simultaneous split test, because many other things change between posts: topic appeal, trends, the day's competition and platform conditions. To improve such tests, use several posts per version, such as at least five or six each; alternate versions rather than doing all A then all B, to spread time effects; keep other factors as similar as possible; compare with your baseline rather than with each other alone; and look at the median of each group. Even then, treat results as suggestive and repeat promising findings.
Worked problem
Testing hook styles across posts
A creator alternates two hook styles over 12 Reels: six with a question hook and six with a result-first hook. Median 3-second hold rates are 61 % for questions and 70 % for result-first, and five of the six result-first Reels exceed the creator's baseline of 64 %. What can the creator conclude?
Show solution
- The result-first median is 9 points higher, and the effect is consistent across most posts.
- Alternating posts reduces the risk that a trend or time period caused the difference.
- Topic appeal still varies, so the evidence is suggestive rather than conclusive.
- Adopt result-first hooks as the default and keep monitoring, or test again with another set of topics.
Answer: Reasonably strong, consistent evidence favors result-first hooks; adopt them provisionally and keep checking.
What to test
Prioritize tests by potential impact and ease. High-impact candidates include packaging (thumbnails, titles, covers, first frames), hooks and openings, length, format choices, calls to action, posting frequency and series concepts. Lower-impact candidates include hashtag counts, minor caption wording and posting times on recommendation-driven platforms. Keep a test log with the hypothesis, method, dates, results and decision. Over time, the log becomes a playbook specific to your audience, far more reliable than generic advice.
Pitfalls and ethics
Common pitfalls include testing too many things at once, ending tests early, ignoring sample size, generalizing from one viral post, measuring the wrong metric (for example, optimizing clicks at the expense of satisfaction), and confirmation bias, seeing only results that support what you hoped. Ethical considerations also apply: tests should not mislead viewers, for example with clickbait packaging that misrepresents content, and experiments on audiences, such as testing manipulative messaging, should respect their interests. Optimizing for long-term trust usually aligns better with sustainable growth than optimizing short-term metrics.
Multivariate and holdout approaches
Larger creators and teams sometimes test several variables at once using multivariate designs, which estimate the effect of each variable from many combinations, or use holdout groups, such as sending a newsletter variation to most subscribers while holding back a random group as a control. These designs require larger audiences and more careful analysis. For most creators, simple one-variable tests, repeated over time, are more practical and easier to interpret.
Learning from natural experiments
Sometimes events create comparisons without deliberate tests: a platform outage on one day, a change in posting schedule forced by travel, or a viral post that suddenly brings a new audience. These natural experiments can be informative if analyzed carefully, comparing periods before and after while considering other changes. They are less reliable than planned tests but can suggest hypotheses to test deliberately.
Worked problem
Planning a thumbnail test
A creator's videos typically earn 60,000 impressions in the first week with a 5 % click-through rate. They want to know whether thumbnails with faces outperform text-only thumbnails by at least 1 percentage point. Is a single video's Test and Compare enough?
Show solution
- Detecting a 1-point difference at a 5 % baseline needs about 7,600 impressions per version.
- With 60,000 impressions split between two versions, each gets about 30,000, which is enough to detect a 1-point difference.
- However, one video tests only one topic; repeating the test on several videos shows whether the effect generalizes.
Answer: Yes for that video, with about 30,000 impressions per version; repeat on several videos to confirm the pattern.
Communicating test results
When sharing results with collaborators or brands, report the hypothesis, the method, the sample sizes, the observed difference, the uncertainty and the decision. Avoid overstating: "Faces in thumbnails increased watch-time share by about 6 points on three of four videos tested" is more accurate and useful than "faces always win". Honest communication of uncertainty builds credibility and leads to better decisions.
Testing posting frequency
Many creators wonder whether posting more often grows an audience faster. Testing frequency is harder than testing packaging, because effects appear over weeks and interact with quality, burnout and audience fatigue. A practical approach is to change frequency for a defined period, such as six weeks, while keeping content types similar, and compare total reach, follows, engagement rates and revenue with the previous period and the same period a year earlier. Watch for falling engagement per post, which may indicate fatigue, and for the creator's own wellbeing. Results often show diminishing returns: doubling frequency rarely doubles growth.
Bayesian thinking for creators
An informal way of reasoning about tests is to treat each result as evidence that updates your beliefs rather than as a final verdict. If you strongly expected faces in thumbnails to help and one test shows a small benefit, your confidence rises modestly; if three tests show no benefit, you revise your belief. This approach, related to Bayesian statistics, encourages accumulating evidence across many tests and avoids overreacting to any single result.
A test log template
A test log can be a simple sheet with columns for the test name, hypothesis, variable changed, metric, method (built-in split test or sequential posts), dates, sample sizes, results with uncertainty, decision and follow-up. Reviewing the log every quarter shows which lessons have held up, which need retesting and which questions remain open. Over a year, a creator who runs one or two careful tests a month builds a body of evidence specific to their audience that no generic advice can match.
Common mistakes
MistakeChanging several things at once.
InsteadTest one variable at a time.
MistakeStopping a test as soon as one version leads.
InsteadFix sample size or duration in advance.
MistakeIgnoring sample size.
InsteadEstimate the sample needed for the effect you care about.
MistakeTreating significance as importance.
InsteadReport effect size and uncertainty.
MistakeTesting misleading packaging.
InsteadOptimize for satisfaction and trust.
Summary and key terms
- Experiments test specific hypotheses by changing one variable.
- Built-in split tests, such as YouTube Test and Compare, are the most reliable.
- Standard errors and confidence intervals show how much results vary by chance.
- Detecting small differences needs large samples.
- Significance is not importance; avoid peeking.
- Sequential tests across posts need several posts per version and alternation.
- Prioritize high-impact tests, keep a log and test ethically.
- Hypothesis
- Specific, testable prediction.
- Independent variable
- What is deliberately changed.
- Dependent variable
- What is measured.
- A/B test
- Comparison of two versions shown to different people.
- Test and Compare
- YouTube tool for testing thumbnails and titles.
- Standard error
- Expected variation of an estimate due to chance.
- Confidence interval
- Range likely to contain the true value.
- Statistical significance
- Result unlikely to be due to chance alone.
- Peeking
- Checking repeatedly and stopping early.
- Effect size
- How large a difference is.
Practice problems
Work each problem on paper first, then reveal the answer to check.
Write a testable hypothesis about hooks.
Show answer
Result-first openings will raise 3-second hold rate versus questions.
What does YouTube Test and Compare use to pick a winner?
Show answer
Share of watch time.
SE of p = 0.10 with n = 900?
Show answer
0.01.
95 % CI for 20 % with SE 1 %?
Show answer
About 18 % to 22 %.
Sample per version for 5 % baseline, 2-point difference?
Show answer
About 1,900.
Why do small channels test only big changes?
Show answer
Small samples detect only large effects.
What is peeking?
Show answer
Stopping a test early when one version leads.
Why alternate versions in sequential tests?
Show answer
To spread time effects across both versions.
Name two high-impact things to test.
Show answer
Packaging, hooks, length, format, calls to action.
Name an ethical concern in testing.
Show answer
Misleading packaging or manipulative messaging.
Lesson quiz · 5 questions
Score 60% or more to complete this lesson.
Create a free account to save your progress, take quizzes and earn a certificate.