
CHE-480 · Lesson 12 of 12 · 23 min
Capstone: environmental compliance and carbon reduction plan for the expansion
Nine months after the board's September meeting, Wren Halvorsen and Theo Laurent have the pieces of the plan. Each of the previous lessons produced one: an emission inventory, a dispersion screening, a particulate and VOC control scheme, boiler burner choices, a wastewater pretreatment design, a water reuse scheme, a waste inventory, a life-cycle assessment and a carbon account. Now they must become one document that a board can approve, a regulator can review and an operator can run. This lesson follows how Wren builds that document, the analysis behind its carbon section, and the board meeting where it is decided.
The structure of the plan
Wren uses a structure she has refined over several permit applications. The plan opens with a two-page summary for the board: what the expansion changes, what it will take to comply, what it will cost, what carbon reduction it can deliver and what decisions are needed now. The body has two parts. The compliance part goes medium by medium, air, water, waste, and for each lists the sources, the controls, the limits the plant will request, the monitoring, and the permits or approvals needed with their timing. The carbon part sets out the carbon accounts, the options, their costs and their effect on carbon intensity, and a staged pathway. Appendices hold the inventory, the modeling, the life-cycle assessment and the calculations, each with its basis and its author.
Part 1: compliance
The air section begins with the inventory from Lesson 1. With all the controls chosen in Lessons 3 to 5, the expanded plant's potential to emit is about 104 t of nitrogen oxides, 91 t of carbon monoxide, 59 t of VOC, 43 t of sulfur dioxide, 42 t of PM10 and 28 t of PM2.5 a year.
In Iowa, each new or modified emission unit needs an air construction permit from the DNR before construction, followed by a modification of the Title V permit. Every pollutant stays below 250 tpy, so the project is a PSD minor modification and no best available control technology review or increment modeling is required, though the DNR will check modeled concentrations against the NAAQS. The scrubber is acceptable only with bisulfite, so the bisulfite system, its feed rate and the scrubber water flow become permit conditions. The new boilers meet the federal boiler standards with ultra-low-NOx burners. The plant continues to report to the TRI and, while the program lasts, to EPA's greenhouse gas program.
| Medium | Main sources | Controls in the plan | Monitoring |
|---|---|---|---|
| Air: VOC, CO, PM | Three dryer sections | High-efficiency cyclones; enlarged RTO, third bed, 97 % thermal efficiency | RTO chamber temperature; stack test at start-up |
| Air: VOC, acetaldehyde | Fermentation vent | Packed scrubber with bisulfite | Water flow, pH, bisulfite feed |
| Air: NOx, CO | Two new 70 MW boilers | Ultra-low-NOx burners, 9 ppm guarantee | NOx and O2 CEMS on one boiler |
| Air: VOC | Ethyl acetate vents | To RTO inlet; carbon beds on standby | Flow and RTO interlock |
| Water | Blowdown, CIP, condensate | Equalization, DAF, neutralization, EGSB reactor | Flow, online pH, composite sampler |
| Water use | Cooling tower | Higher cycles, RO on blowdown, condensate reuse | Submeters, water balance |
| Waste | EtOAc heavies, lab solvents, sludge | Heavies recycled; sludge land applied | Manifests, inventory, audits |
The water section sets out the equalization tank, the DAF and the EGSB reactor of Lessons 6 and 7, with the biogas going to the boilers. The plant will negotiate a revised agreement with the city covering the new discharge, which will be steadier, near neutral and below the surcharge strength. The water reuse section commits to holding city water at today's level through the expansion with RO on the cooling tower blowdown and more condensate returned to the cook, a water intensity of about 3.0 L/L. The waste section lists the new streams, their classification and their routes, and commits to registering them before start-up.
Each item has a permit, an owner and a date. The permit amendment is the critical path: Wren plans to file the application within six weeks of the board's approval, using vendor guarantees for the new equipment and conservative estimates elsewhere, and to start construction of the affected units only when the approval is in hand. Ingrid Solheim, as a licensed PE, will seal the engineering in the application.
Part 2: carbon
The carbon section starts from the accounts of Lesson 11: about 100 kt a year of scope 1, scope 2 that depends on the grid, about 180 kt of scope 3 from corn, and about 180 kt of biogenic fermentation carbon dioxide. Its question is which reductions to make, in what order, and at what cost. The standard tool is a marginal abatement cost curve. For each option, the annual cost is the capital cost annualized with a capital recovery factor, plus operating cost, minus savings in fuel or power; the cost per metric ton is that annual cost divided by the metric tons avoided each year. The options are then sorted from cheapest to dearest, and plotted as bars whose width is the metric tons avoided and whose height is the cost per metric ton.
# Capstone: marginal abatement cost of the carbon options for the expanded plant (Iowa values)
GRID, GAS, POWER = 400.0, 4.0, 0.08    # g/kWh, gas price per GJ, power price per kWh (illustrative)
CRF = 0.10 / (1 - 1.10 ** -15)         # 10 %, 15 years
GAL, LHV = 240e6 / 3.78541, 21.2 * 240e6   # gallons per year, MJ per year
opts = [  # name, capital (millions), fixed O&M (millions/yr), gas saved TJ/yr, power added GWh/yr, biogenic CO2 stored kt/yr
 ('RTO heat recovery 90 -> 97 %',      3.0, 0.05, 118,   0.0,   0),
 ('Biogas to boiler',                  1.5, 0.05,   6,   0.0,   0),
 ('Evaporator and still MVR',         18.0, 0.30, 288,  12.0,   0),
 ('Fermentation CO2 capture, storage', 60.0, 6.30,  0,  18.9, 172),
]
rows = []
for n, cap, om, gas, pw, st in opts:
    fossil = gas * 56.0 / 1000 - pw * GRID / 1000
    abated = fossil + st
    cost = CRF * cap + om - gas * GAS / 1000 + pw * POWER
    rows.append((cost * 1000 / abated, n, abated, fossil, cost))
print(f"capital recovery factor {CRF:.4f}")
for c, n, a, f, cost in sorted(rows):
    print(f"{n:35s}{a:6.1f} kt/yr  {c:7.0f} per t  (fossil {f:5.1f} kt)")
# 45Z: every kt of CI reduction lowers the CI by kt*1e9/LHV g/MJ; factor = (50 - 1.055 CI)/50
ci0 = 51.8; total = sum(a for _, _, a, _, _ in rows)
ci = ci0 - total * 1e9 / LHV + 1.5                    # capture pays 1.5 g/MJ for transport and storage
f = max(0.0, (50 - 1.055 * ci) / 50)
print(f"all four options: CI {ci:.1f} g/MJ, 45Z factor {f:.3f}, credit {f*GAL/1e6:.1f} million per year")
print(f"45Q instead, on 172 kt stored: {172*85/1000:.1f} million per year")capital recovery factor 0.1315 RTO heat recovery 90 -> 97 % 6.6 kt/yr -4 per t (fossil 6.6 kt) Fermentation CO2 capture, storage 164.4 kt/yr 95 per t (fossil -7.6 kt) Evaporator and still MVR 11.3 kt/yr 218 per t (fossil 11.3 kt) Biogas to boiler 0.3 kt/yr 664 per t (fossil 0.3 kt) all four options: CI 17.4 g/MJ, 45Z factor 0.633, credit 40.1 million per year 45Q instead, on 172 kt stored: 14.6 million per year
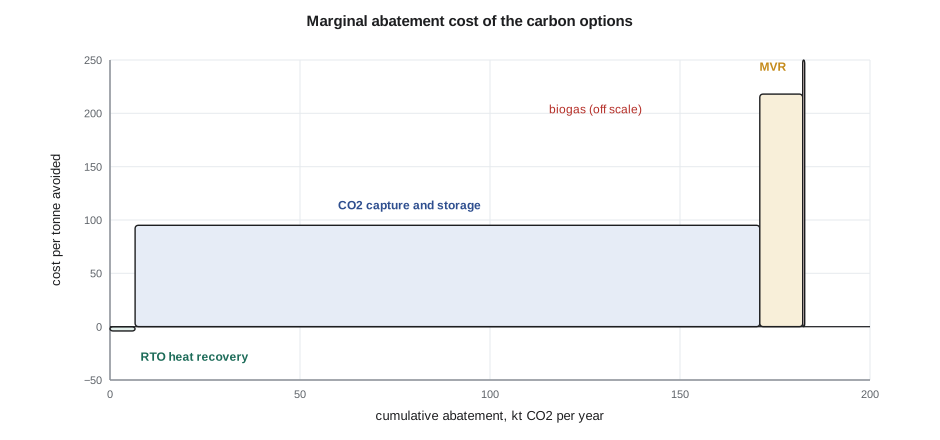
The curve has a clear shape. Restoring and upgrading the RTO heat recovery costs less than nothing: the gas it saves pays for it. Capture and storage of the fermentation carbon dioxide is by far the largest option, at a cost of about 95 per metric ton before any credit. Vapor recompression on the evaporators and stills is smaller and dearer per metric ton, because it trades gas for electricity and its capital is large for the metric tons it saves. Burning biogas is very expensive per metric ton of carbon, but that is the wrong way to see it: the anaerobic reactor is justified by the wastewater, and the biogas is a by-product whose use is almost free once the reactor exists.
In Iowa, the picture depends on a threshold. With all four options, the plant's emissions rate for 45Z would fall to about 17 g/MJ, and the credit would be worth about 40 million dollars a year. Without capture, the plant-side measures alone bring the rate down by only about 3.5 g/MJ, from about 52 to about 48 g/MJ, or about 51 kg/MMBtu, still just above the 50 kg/MMBtu threshold, so they earn no 45Z credit by themselves. And the 45Z credit ends after 2029 under the 2025 law, while 45Q pays for 12 years from when the capture equipment starts. For a capture project that cannot start before 2029, 45Q at about 14.6 million dollars a year for 12 years is the credit to plan on, with 45Z an upside only if Congress extends it.
Worked problem
Cost per metric ton of an abatement option
An option costs 12 million dollars of capital, has a capital recovery factor of 0.1315, adds 0.2 million dollars a year of operating cost, saves 1.0 million dollars a year of gas, and avoids 9 kt CO₂ a year. What is its cost per metric ton?
Show solution
- Annualized capital \(= 0.1315 \times 12 = 1.578\) million dollars a year.
- Net annual cost \(= 1.578 + 0.2 - 1.0 = 0.778\) million dollars a year.
- Cost per metric ton \(= 778\,000 / 9\,000 = 86\) dollars per metric ton.
Answer: About 86 dollars per metric ton.
The staged pathway
Wren's recommendation is a pathway in three stages, ordered by certainty and cost. The first stage is built with the expansion and is not optional: the compliance measures, plus every carbon measure that pays for itself or is needed anyway, namely the RTO upgrade, the ultra-low-NOx boilers, the anaerobic reactor with biogas to the boilers, the RO water reuse and the vents to the RTO. The second stage is MVR and heat integration on the evaporators and stills, designed into the expansion so it can be added within two years, with its final approval tied to gas and power prices and to the value of the carbon intensity reduction. The third stage is capture and storage of the fermentation carbon dioxide. It is the largest and most valuable, and also the most uncertain, because it depends on infrastructure outside the plant's control: a pipeline connection to Summit. The plan recommends spending now on what makes capture possible later: space in the plot plan for the compressor building, a tie-in on the scrubber outlet, and a front-end engineering study, with a decision gate when the storage route is firm.
Theo, writing the risk section, lists what could change the answer. Credit prices and tax law can move by half in either direction. Storage could be delayed by years or could arrive sooner. Gas prices move the MVR economics. A new rule could tighten the plant's NOx or PM2.5 limits. Each risk has a trigger, an owner and a response in the plan. Nadia reviews the safety implications of each option; Priya reviews the occupational ones; Dev reviews the sampling and analysis the monitoring needs; and Malik reviews the money.
Presenting to the board
The board meeting in June gives the plan forty minutes. Wren speaks for ten, using four slides: what the expanded plant will emit and how it will comply; what it will cost; the carbon pathway as a single line from today's carbon intensity to the target; and the decisions needed. She does not show the abatement curve until a director asks why capture is not in the first stage, and then uses it to show that capture is the cheapest large option per metric ton, and the riskiest. Malik covers the money: the compliance measures add a few percent to the expansion capital and remove the sewer surcharge; the first-stage carbon measures pay for themselves; capture is a separate investment decision for later.
The questions are pointed. One director asks whether the plant could skip the RTO enlargement and run the dryers cooler instead. Wren answers that cooler drying is part of the plan but cannot alone meet the VOC limit for three dryer sections. Another asks whether zero liquid discharge should be reconsidered; Wren refers him to the water study and its conclusion. The investor who asked about water asks whether the carbon intensity claims will be audited; Wren confirms that the life-cycle assessment will have an independent critical review and that the carbon intensity is verified for the fuel program each year. The chair asks the question Wren expected: what happens if the permit takes longer than planned? Ingrid answers that the schedule allows nine months for the permit, that the application will be filed early with conservative estimates, and that the units that do not affect emissions can be built first.
The decision
The board approves the expansion with the plan as a condition of the funding. It approves stage 1 in full, approves the design provisions for stages 2 and 3, and asks for a decision paper on capture when the storage route is firm. It asks for an annual report on compliance, water intensity and carbon intensity against the plan's targets. Wren files the permit application three weeks later.
Theo's last task is the one Wren insists on for every project: a short note for the file of what the team learned. He writes four points. Environmental engineering is process engineering, and the mass balance is the most important tool. Prevention and recovery beat treatment, and they usually also cost less. Compliance and carbon are now two separate problems with two separate logics, one binary and enforced, the other continuous and priced, and a plan has to address both. And every number needs a source, because someone will ask.
Common mistakes
MistakeWriting a plan as a list of technologies.
InsteadOrganize by medium and source, with limits, monitoring, permits, owners and dates.
MistakeSorting carbon options by total metric tons alone.
InsteadUse cost per metric ton and size together; a MAC curve shows both.
MistakeValuing biogas by its carbon cost per metric ton alone.
InsteadIt is a by-product of a reactor justified by wastewater; judge the system.
MistakeCommitting now to a project that depends on outside infrastructure.
InsteadMake low-cost provisions now and set a decision gate for when the dependency is firm.
MistakePresenting every calculation to a board.
InsteadLead with what changes, what it costs, what it delivers and what must be decided; keep details in appendices.
Summary and key terms
- The plan combines a compliance part, organized by medium and source, and a carbon part with accounts, options and a pathway.
- Each compliance item has controls, limits, monitoring, permits, an owner and a date; the permit is the critical path.
- A marginal abatement cost curve sorts options by cost per metric ton with width equal to metric tons avoided.
- Credits and carbon prices change which options pay, and policy timing matters as much as the rates.
- A staged pathway builds certain measures now and keeps uncertain ones open with provisions and decision gates.
- Every number in the plan traces to a source and a responsible engineer.
- Marginal abatement cost curve
- A chart of abatement options sorted by cost per metric ton, with bar widths equal to metric tons avoided.
- Capital recovery factor (CRF)
- The factor that converts a capital cost into an equal annual payment at a given interest rate and life.
- Decision gate
- A planned point at which a project is approved, changed or stopped based on defined conditions.
- Critical path
- The sequence of tasks that sets the earliest completion date of a project.
- Synthetic minor limit
- An enforceable permit limit that keeps a source below a major-source threshold.
- Critical review
- Independent review of an LCA required for public comparative claims.
Practice problems
Work each problem on paper first, then reveal the answer to check.
What is the capital recovery factor at 10 % over 15 years?
Show answer
About 0.1315.
Why is the RTO upgrade at the left of the MAC curve?
Show answer
Its gas savings exceed its annualized cost, so its cost per metric ton is negative.
Why is capture in the third stage despite its low cost per metric ton?
Show answer
It depends on storage infrastructure outside the plant's control.
What provisions keep capture open?
Show answer
Plot space, a scrubber outlet tie-in and a front-end engineering study.
What two parts does the plan have?
Show answer
Compliance, by medium and source, and carbon, with accounts, options and a pathway.
Why must the LCA have an independent critical review?
Show answer
The plant will make public comparative claims about its carbon intensity.
Lesson quiz · 5 questions
Score 60% or more to complete this lesson.
Create a free account to save your progress, take quizzes and earn a certificate.