
CHE-480 · Lesson 10 of 12 · 23 min
Life-cycle assessment
The plant's ethanol is sold not just by the liter but by its carbon intensity: the greenhouse gas emissions over its whole life cycle, from the corn field to the car's tailpipe, per megajoule of fuel. Under the federal Renewable Fuel Standard and the section 45Z clean fuel production credit, a lower carbon intensity is worth real money. The number is calculated with Argonne National Laboratory's GREET model, in the 45ZCF-GREET version that Treasury adopted for the clean fuel production credit, from the plant's own data on corn, energy and co-products. Malik wants to know what the plant's current number is, what drives it, and which parts the expansion can change. Wren has done the annual carbon intensity filing for three years, but the expansion needs more than a filing: it needs a life-cycle assessment that the board and the plant's customers can rely on. Theo is asked to learn the method properly.
What a life-cycle assessment is
A life-cycle assessment (LCA) estimates the environmental impacts of a product over its whole life: raw material extraction, processing, manufacturing, distribution, use and end of life. Its value is that it shows where impacts actually occur, which is often not where people expect, and it prevents problem shifting: solving one impact by creating another somewhere else in the chain. The method is standardized in ISO 14040, which sets out the principles and framework, and ISO 14044, which gives the requirements and guidelines. A study that claims to follow them has four phases: goal and scope definition, inventory analysis, impact assessment and interpretation. The phases are iterative; findings in a later phase often send the analyst back to refine the scope.
Goal and scope
The goal states why the study is being done and who will use it. The scope defines the product system, its boundaries, the functional unit, the allocation rules, the impact categories and the data requirements. The functional unit is the quantified function the product delivers, against which everything is measured. For a transportation fuel the usual unit is 1 MJ of fuel energy, because fuels are compared by the energy they deliver to an engine, not by volume or mass. A liter of ethanol contains about two-thirds of the energy of a liter of gasoline, so comparing per liter would flatter ethanol.
The system boundary decides which processes are included. A cradle-to-gate study stops at the plant gate; a cradle-to-grave or well-to-wheels study, which fuel regulations use, includes distribution and combustion in the vehicle. For ethanol, the boundary includes corn farming (fertilizer production, nitrous oxide from soils, diesel for machinery, drying the grain), transport to the plant, the plant's energy and chemicals, distribution of the ethanol, and its combustion. The carbon dioxide from burning the ethanol, and from the fermentation, is biogenic: the corn took it from the air a few months earlier, so it is counted as zero. Methane and nitrous oxide from combustion are not biogenic in that sense and are counted.
Inventory analysis
The inventory is a mass and energy balance of the whole product system: every input of material and energy and every output of product, co-product, emission and waste, for each process in the boundary, scaled to the functional unit. Foreground data, from the processes the study owner controls, should be measured: the plant's own natural gas, electricity, chemicals, corn and products from its meters and records. Background data, for processes outside its control such as fertilizer production or the electricity grid, come from databases. The quality of an LCA depends heavily on the foreground data, and at Cedar Rapids those are the same meters that feed the plant's mass balance.
Co-products and allocation
Most processes make more than one product, and the burden of the process must be shared among them. An ethanol plant makes about as much DDGS by mass as ethanol, plus corn oil. How much of the farming and plant emissions belongs to the ethanol? ISO 14044 gives a preference order. First, avoid allocation by dividing the process into sub-processes or by expanding the system to include the alternative production of the co-product (system expansion, or the displacement method): the DDGS replaces corn and soybean meal in animal feed, so the emissions avoided by not producing that feed are credited to the ethanol. If that is not possible, allocate by a physical relationship such as mass or energy content. Only as a last resort, allocate by another relationship, such as economic value.
# Carbon intensity of the plant's ethanol (g CO2e per MJ), with three ways of handling DDGS
LHV, L_per_t = 21.2, 393.0                  # MJ/L ethanol; L ethanol per metric ton corn
MJ_t = LHV * L_per_t                        # MJ of ethanol per metric ton of corn
GRID = 400.0                                # g CO2e/kWh, Iowa grid (illustrative round value)
stages = {                                  # burdens before co-product treatment, g/MJ
 'corn farming (N2O, fertilizer, fuel)': 291e3 / MJ_t,
 'corn transport':                        6e3 / MJ_t,
 'plant natural gas (7.5 MJ/L)':          7.5 * 66.0 / LHV,
 'plant electricity (0.20 kWh/L)':        0.20 * GRID / LHV,
 'chemicals, enzymes and yeast':          2.0,
 'land-use change (model value)':         7.6,
}
after = {'ethanol distribution': 1.5, 'tailpipe CH4 and N2O': 0.8}
gate = sum(stages.values())
for k, v in {**stages, **after}.items(): print(f"{k:38s}{v:6.1f}")
ddgs_t, eth_t = 18.0, 18.8                 # t/h
credit = -(ddgs_t / 60.6) * 400e3 / MJ_t - 1.0   # displacement: DDGS 400 kg/t, corn oil 1 g/MJ
ci_disp = gate + credit + sum(after.values())
shares = {'mass': eth_t / (eth_t + ddgs_t),
          'energy': eth_t * 26.8 / (eth_t * 26.8 + ddgs_t * 19.0),
          'market value': eth_t * 700 / (eth_t * 700 + ddgs_t * 230)}
print(f"{'displacement (system expansion)':38s}{ci_disp:6.1f}")
for k, f in shares.items():
    print(f"{k + ' allocation':38s}{gate * f + sum(after.values()):6.1f}   (ethanol share {f:.0%})")
print(f"reduction from gasoline at 93 g/MJ, displacement case: {100*(1-ci_disp/93):.0f} %")
no_luc = ci_disp - stages['land-use change (model value)']
kg_mmbtu = no_luc * 1.055                  # g/MJ -> kg/MMBtu
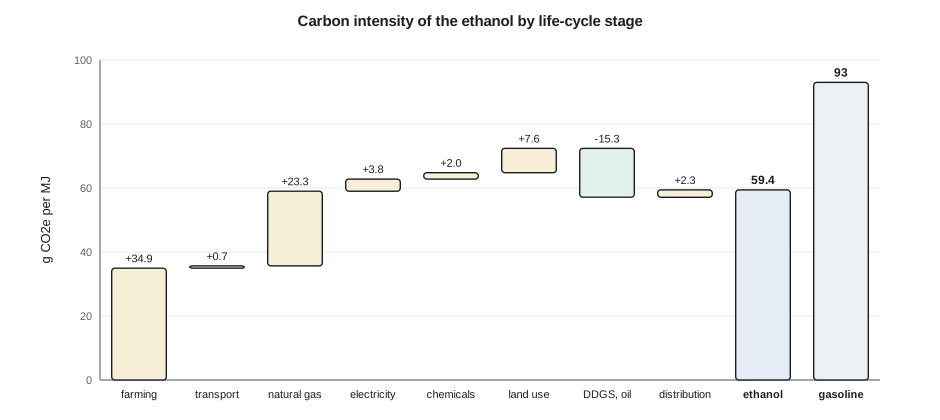
print(f"without land-use change: {no_luc:.1f} g/MJ = {kg_mmbtu:.1f} kg/MMBtu; 45Z factor {max(0,(50-kg_mmbtu)/50):.2f}")corn farming (N2O, fertilizer, fuel) 34.9 corn transport 0.7 plant natural gas (7.5 MJ/L) 23.3 plant electricity (0.20 kWh/L) 3.8 chemicals, enzymes and yeast 2.0 land-use change (model value) 7.6 ethanol distribution 1.5 tailpipe CH4 and N2O 0.8 displacement (system expansion) 59.4 mass allocation 39.3 (ethanol share 51%) energy allocation 45.4 (ethanol share 60%) market value allocation 57.4 (ethanol share 76%) reduction from gasoline at 93 g/MJ, displacement case: 36 % without land-use change: 51.8 g/MJ = 54.7 kg/MMBtu; 45Z factor 0.00
The choice of method moves the answer a long way. With displacement the plant's ethanol comes out at about 59 g CO₂e/MJ. Mass allocation, which gives the DDGS almost half the burden, gives nearly 20 g/MJ less. Market value allocation, which gives ethanol about three-quarters of the burden because it sells for much more per metric ton, comes out close to the displacement result. None of these is wrong; they answer slightly different questions. What matters is that the method is stated, justified and applied consistently, and that regulatory numbers use the method the regulation prescribes. Fuel carbon intensity models generally use displacement for distillers grains.
Reading the result
Two stages dominate. Corn farming contributes about 35 g/MJ, more than half of the total before the co-product credit. Most of that is nitrous oxide released from soils as nitrogen fertilizer is transformed by microbes, plus the energy-intensive production of ammonia fertilizer. The plant's natural gas, for steam and for the dryers, contributes about 23 g/MJ. Electricity adds about 4 g/MJ, with the Iowa grid at about 400 g CO₂e/kWh. Land-use change, explained below, adds a modeled value of a few grams. The DDGS and corn oil credit removes about 15 g/MJ. The total, about 59 g/MJ, is about 36 % below gasoline's roughly 93 g/MJ on this basis.
Theo notices what the plant can and cannot change. Farming emissions are outside the fence, though the plant can influence them through the corn it buys, and both fuel programs have been developing ways to credit low-carbon farming practices, measured field by field. Natural gas is inside the fence and is the largest lever the plant controls directly: every megajoule of gas saved per liter of ethanol lowers the carbon intensity by about 3 g/MJ. And there is one large stream the LCA treats as zero because it is biogenic: the fermentation carbon dioxide. If it were captured and stored permanently instead of released, the ethanol would be credited with removing it from the atmosphere. Lesson 11 shows that this is the single largest change available to the plant.
Worked problem
Effect of a natural gas saving
Heat integration cuts the plant's natural gas from 7.5 to 6.3 MJ per liter of ethanol. With 66 g CO₂e per MJ of gas (combustion plus upstream) and 21.2 MJ per liter of ethanol, how much does the carbon intensity fall?
Show solution
- Gas saved per liter \(= 7.5 - 6.3 = 1.2\) MJ.
- Emissions avoided per liter \(= 1.2 \times 66 = 79\) g CO₂e.
- Per MJ of ethanol \(= 79 / 21.2 = 3.7\) g/MJ.
Answer: About 3.7 g CO₂e/MJ.
Land-use change
When demand for corn rises, farmers may plant more of it, and somewhere in the world land may be converted from forest or grassland to cropland, releasing carbon stored in soil and vegetation. Direct land-use change is conversion on the land that grew the crop; indirect land-use change (ILUC) is the global market response, estimated with economic models. ILUC estimates for corn ethanol have varied widely between models and over time, from a few to more than 30 g/MJ, and they remain the most debated number in biofuel LCA. Programs treat it differently.
Theo's calculation includes a modeled land-use change value of 7.6 g/MJ, a round value used for illustration. For the section 45Z credit the treatment changed in 2025: the federal tax law passed that year excluded indirect land-use change from the emissions rate used for the credit, for fuel produced after 2025. Without it, the plant's ethanol comes out at about 52 g/MJ, or about 55 kg CO₂e per million Btu in the units the credit uses. The credit is worth something only below 50 kg/MMBtu, so on this basis the plant earns nothing from it today. That single number frames the whole carbon plan.
Impact assessment
Life-cycle impact assessment converts the inventory into impact categories. Climate change is the best known: each greenhouse gas is multiplied by its global warming potential over 100 years (GWP100), which is 1 for carbon dioxide and roughly 28 to 30 for fossil methane and 265 to 273 for nitrous oxide in recent IPCC assessments, and the results are summed as CO₂ equivalents. Other categories include acidification (from sulfur dioxide, nitrogen oxides and ammonia), eutrophication (from nitrogen and phosphorus reaching water), water use, land use, particulate formation and toxicity. A fuel regulation looks only at climate change, but a full LCA looks wider, because corn ethanol scores well on fossil carbon and less well on eutrophication and land use than gasoline. Wren insists that the board see the whole picture, not just the number that earns credits.
Interpretation, uncertainty and critical review
The interpretation phase checks the results for completeness, sensitivity and consistency, and draws conclusions within the limits of the data. Sensitivity analysis is essential: the plant's carbon intensity moves by several grams with the nitrous oxide emission factor, the DDGS credit, the land-use change value and the grid factor, each of which is uncertain. ISO 14044 requires a critical review by an independent expert or panel when an LCA is used to support a comparative assertion disclosed to the public, such as a claim that one fuel is better than another. Wren plans an external review of the expansion LCA for exactly that reason; the plant intends to tell its customers that the expanded plant's ethanol has a lower carbon intensity, and that claim must stand up.
| ISO 14040/44 phase | At the plant | Main judgment |
|---|---|---|
| Goal and scope | Carbon intensity of ethanol, well to wheels, per MJ | Boundary, functional unit, allocation |
| Inventory | Corn, gas, power, chemicals, products from plant meters | Data quality, background databases |
| Impact assessment | GWP100 for climate; other categories for the board | Characterization factors |
| Interpretation | Sensitivity to N2O, DDGS credit, land use, grid | Uncertainty, critical review |
Using LCA in design
The most useful LCA is the one done before the plant is built, because it can still change the design. Theo builds a simple version of the model into a spreadsheet so the design team can test each option of the expansion as it is proposed: heat integration and vapor recompression on the evaporators and stills, recovering more heat in the RTO, burning biogas, buying renewable electricity, and capturing the fermentation carbon dioxide. Each option shows up as a change in g/MJ. Lesson 12 will put a cost beside each one, and the combination becomes the carbon reduction half of the board's plan.
Common mistakes
MistakeComparing fuels per liter.
InsteadUse an energy-based functional unit such as 1 MJ; ethanol has about two-thirds of gasoline's energy per liter.
MistakeChoosing the allocation method that gives the best number.
InsteadFollow the ISO preference order or the method a regulation prescribes, state it, and apply it consistently.
MistakeCounting biogenic CO2 from fermentation as an emission.
InsteadIt is biogenic and counted as zero; capturing and storing it earns a credit.
MistakeReporting a single carbon intensity without sensitivity.
InsteadShow how N2O factors, land use, co-product credits and grid values move the result.
MistakeAssuming a good climate score means a good score everywhere.
InsteadCheck eutrophication, water and land use as well.
Summary and key terms
- LCA follows ISO 14040 and 14044 through goal and scope, inventory, impact assessment and interpretation.
- Fuels use a functional unit of 1 MJ and a well-to-wheels boundary; biogenic CO2 counts as zero.
- Co-products are handled by system expansion where possible, then physical allocation, then economic allocation.
- Farming and plant natural gas dominate the plant's carbon intensity; the DDGS credit offsets part.
- Land-use change is uncertain and treated differently by different programs.
- Sensitivity analysis and critical review make an LCA credible enough to support public claims.
- Functional unit
- The quantified function against which all inputs and outputs are measured, such as 1 MJ of fuel.
- System boundary
- The set of processes included in the product system.
- System expansion
- Crediting a co-product with the emissions of the product it displaces.
- Allocation
- Dividing a process burden among co-products by mass, energy or value.
- Indirect land-use change (ILUC)
- Emissions from land conversion elsewhere caused by market responses to crop demand.
- GWP100
- Global warming potential over 100 years relative to carbon dioxide.
Practice problems
Work each problem on paper first, then reveal the answer to check.
Why is 1 MJ a better functional unit than 1 L for fuels?
Show answer
Fuels deliver energy; ethanol has much less energy per liter than gasoline.
What is the ISO 14044 preference for handling co-products?
Show answer
Avoid allocation by subdivision or system expansion, then physical allocation, then economic.
Why is fermentation CO2 counted as zero?
Show answer
It is biogenic carbon recently taken from the air by the corn.
Which two stages dominate the plant's carbon intensity?
Show answer
Corn farming and plant natural gas.
Cutting 0.5 MJ of gas per liter lowers carbon intensity by about how much?
Show answer
\(0.5 \times 66 / 21.2 = 1.6\) g/MJ.
When does ISO 14044 require a critical review?
Show answer
When an LCA supports a comparative assertion disclosed to the public.
Lesson quiz · 5 questions
Score 60% or more to complete this lesson.
Create a free account to save your progress, take quizzes and earn a certificate.