
CHE-390 · Lesson 5 of 12 · 23 min
Microbial growth kinetics
When yeast is pitched into a fermenter of fresh mash at Kingfisher Bioenergy, the cell count rises from about ten million per milliliter to more than a hundred million within the first day, then levels off while the ethanol keeps rising. The shape of that curve, and the factors that change it, are the subject of growth kinetics. Rosa gives Theo a year of cell count records from the plant laboratory and asks him to describe them with equations he could use to design the new fermenter.
Measuring growth
Cell concentration can be measured as dry cell weight, by filtering, washing and drying a sample; as optical density, by the turbidity of a diluted sample; or as cell number, by counting under a microscope in a hemocytometer or with an automated counter. In corn mash, the solids make dry weight and turbidity unreliable, so plants count cells and use a stain such as methylene blue to tell live from dead: living yeast reduce the dye and stay clear, dead cells stain blue. Viability, the fraction of cells alive, is as important as the count. For growth equations, counts are converted to dry mass with an average mass per cell, roughly 60 pg dry weight for a yeast cell, though it varies with growth conditions.
The growth curve
A batch culture passes through recognizable phases. In the lag phase the cells adapt to the new medium, making the enzymes they need, and grow little. In the exponential phase they grow at a constant specific rate, so the concentration doubles at regular intervals. As a nutrient runs out or a product accumulates, growth slows in a deceleration phase and stops in the stationary phase, where the cells may still be metabolically active: in the fermenter, yeast in stationary phase still make ethanol. Finally, in the death phase, viable numbers fall. The lag phase is shortened by pitching healthy, actively growing yeast from the propagation tank, which is one reason propagation matters.
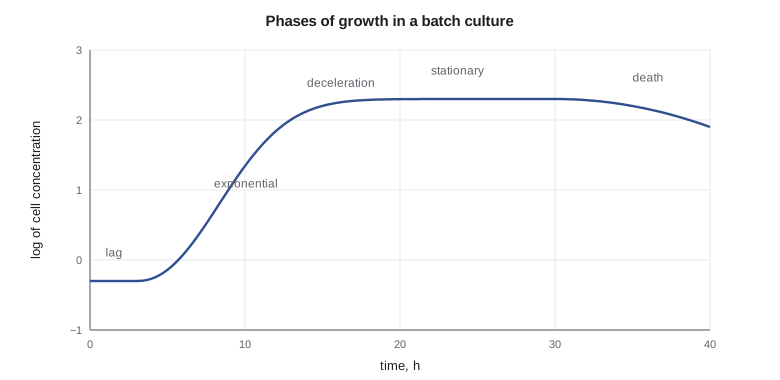
Exponential growth
During exponential growth, the rate of cell formation is proportional to the cell concentration \(X\):
where \(\mu\) is the specific growth rate, in reciprocal hours, and \(t_d\) the doubling time. On a plot of \(\ln X\) against time, exponential growth is a straight line with slope \(\mu\). The code fits such a line to four counts from the plant laboratory and finds \(\mu\) of about 0.39 h⁻¹, a doubling time of about 1.8 h, which is typical of a good industrial yeast under favorable conditions.
Worked problem
Doubling time
Yeast grows from \(1.0 \times 10^7\) to \(8.0 \times 10^7\) cells per milliliter in 6 h of exponential growth. Find \(\mu\) and the doubling time.
Show solution
- Three doublings, since \(8 = 2^3\).
- \(t_d = 6/3 = 2.0\) h; \(\mu = 0.693/2.0 = 0.35\) h⁻¹.
Answer: \(\mu = 0.35\) h⁻¹; doubling time 2.0 h.
The Monod equation
Growth slows when the limiting substrate becomes scarce. The Monod equation describes this with the same form as Michaelis-Menten kinetics, though it is an empirical description of a whole network of enzymes rather than a mechanism:
Here \(\mu_{max}\) is the maximum specific growth rate and \(K_s\) the substrate concentration at which growth is half its maximum. For yeast on glucose \(K_s\) is small, a fraction of a gram per liter, so growth is near its maximum until glucose is almost exhausted. In an ethanol fermenter glucose is supplied gradually by glucoamylase, and it is usually the release rate, not the Monod term, that limits growth late in the batch.
Product inhibition
Ethanol inhibits yeast. As it accumulates, it disrupts the cell membrane, slows transport and enzyme activity, and eventually stops growth and then fermentation. A common model multiplies the Monod term by a factor that falls to zero at a maximum ethanol concentration \(P_{max}\):
For industrial fuel ethanol strains, growth stops at somewhere around 90 to 120 g/L of ethanol, depending on strain, temperature and nutrition, while fermentation continues to higher concentrations, which is why the yeast in a corn mash keeps making ethanol after it stops growing. High temperature, low nitrogen, organic acids from bacteria and high osmotic pressure all reduce ethanol tolerance and can cause a stuck fermentation, one that stops before the sugar is used.
Yields and maintenance
Growth is linked to substrate consumption by a yield coefficient, \(Y_{X/S}\), the mass of cells formed per mass of substrate consumed. But cells also use energy just to stay alive: to maintain ion gradients across the membrane, repair molecules and move. This maintenance demand consumes substrate even when the cells do not grow. Pirt's model adds a maintenance coefficient \(m_s\):
Under anaerobic conditions, maintenance energy comes from fermentation, so maintenance also makes ethanol. In a long fermentation where cells have stopped growing, maintenance and the non-growth part of product formation are what keep the ethanol rising.
A batch fermentation model
The code integrates the equations for cells, glucose and ethanol in a batch with 200 g/L of glucose available at the start, a two-hour lag and illustrative constants. It is a simplification: in the real fermenter glucose appears gradually from dextrins, which spreads the fermentation over two days instead of twenty hours, but the shape of the curves is right.
import math
# Batch growth of yeast: Monod kinetics with ethanol inhibition (illustrative constants)
mu_max, Ks = 0.30, 0.5           # 1/h, g/L glucose
Pmax, n = 115.0, 1.0             # ethanol at which growth stops, g/L, and inhibition exponent
Yxs, Yps, ms = 0.05, 0.48, 0.1   # g cells/g glucose, g ethanol/g glucose, maintenance g glucose/g cells/h
X, S, P, t, dt = 0.5, 200.0, 0.0, 0.0, 0.01
lag = 2.0
print("  t h   X g/L   S g/L   P g/L")
while t <= 32:
    if abs(t - round(t/4)*4) < dt/2: print(f"{t:5.0f} {X:7.2f} {S:7.1f} {P:7.1f}")
    mu = 0.0 if t < lag else mu_max*S/(Ks+S)*max(0.0, 1-P/Pmax)**n
    rx = mu*X; rs = rx/Yxs + ms*X if S > 0 else 0.0
    rp = Yps*rs
    X += rx*dt; S = max(0.0, S - rs*dt); P += rp*dt; t += dt
# Estimating mu_max from exponential-phase data
ts = [3, 4, 5, 6]; Xs = [0.55, 0.81, 1.20, 1.78]
lx = [math.log(x) for x in Xs]; m = sum(ts)/4; ml = sum(lx)/4
slope = sum((a-m)*(b-ml) for a, b in zip(ts, lx)) / sum((a-m)**2 for a in ts)
print(f"specific growth rate from data {slope:.3f} 1/h, doubling time {math.log(2)/slope:.2f} h") t h X g/L S g/L P g/L
0 0.50 200.0 0.0
4 0.90 191.8 4.0
8 2.65 156.2 21.0
12 5.99 87.7 53.9
16 9.36 17.2 87.8
20 10.14 0.0 96.0
24 10.14 0.0 96.0
28 10.14 0.0 96.0
specific growth rate from data 0.392 1/h, doubling time 1.77 hThe cells grow exponentially for the first twelve hours or so, then slow as ethanol rises. Growth stops when the glucose is gone, with about 10 g/L of cells and 96 g/L of ethanol. Theo plots the model against the plant's cell counts and finds that the model reaches its peak too early, as expected, because the plant's glucose comes from saccharification. He adds a glucose release term based on Dev's enzyme kinetics from lesson 3, which stretches the model fermentation to about 50 hours and matches the plant data much better. Rosa is pleased: a model that matches the plant can be used to test what would happen with a different temperature or enzyme dose before trying it in a two-million-liter tank.
Worked problem
Substrate used for maintenance
A fermenter holds 10 g/L of non-growing yeast with \(m_s = 0.1\) g/g/h. How much glucose is used for maintenance in 20 h, and how much ethanol does it make at 0.48 g/g?
Show solution
- Glucose: \(0.1 \times 10 \times 20 = 20\) g/L.
- Ethanol: \(20 \times 0.48 = 9.6\) g/L.
Answer: 20 g/L of glucose and about 10 g/L of ethanol.
Temperature and pH effects
Growth rate rises with temperature up to an optimum and falls sharply above it, as enzymes and membranes are damaged. For S. cerevisiae the optimum for growth is around 30 to 35 °C, and the tolerance to ethanol falls as temperature rises, so a fermenter that runs hot finishes early with high residual sugar. That is the main reason fermenter cooling is critical, and why plants in warm climates have trouble in summer. pH affects growth less within the yeast's tolerant range but strongly affects contaminating bacteria, which is used to advantage in contamination control.
| Parameter | Typical value for industrial yeast | Comment |
|---|---|---|
| μmax on glucose | 0.3–0.45 h⁻¹ | Lower in concentrated mash |
| Ks for glucose | 0.1–1 g/L | Growth rarely glucose-limited until near the end |
| Pmax for growth | about 90–120 g/L ethanol | Strain and temperature dependent |
| Y_X/S anaerobic | about 0.05 g/g | About 0.5 g/g with oxygen |
| Maintenance coefficient | about 0.05–0.2 g/g/h | Higher under stress |
Using the model for decisions
Theo uses his calibrated model to answer three questions from Malik. The first is how much a higher pitch rate would help. Starting with twice as many cells shortens the lag and the exponential phase by about one doubling time, roughly two hours out of a fifty-hour batch, a gain of a few percent in fermenter capacity. The second is the cost of a hot afternoon. Raising the fermenter temperature from 32 to 35 °C speeds early growth but lowers the ethanol at which growth stops; the model predicts a faster start and a lower final ethanol unless cooling holds the temperature down late in the batch, which matches what Carla has seen in July.
The third question is whether the plant could run with a more concentrated mash, which would raise ethanol in the beer and save distillation energy. The model says that the gain is limited by ethanol tolerance: above about 130 to 140 g/L of potential ethanol, the yeast stalls before the sugar is used unless nutrition and temperature are excellent. Very high gravity fermentation is practiced, but it demands robust yeast, good nitrogen supply and tight temperature control. Theo records the model's limitations alongside its answers: it lumps all sugars together, assumes ideal mixing, and its inhibition constants come from one strain and one season's corn.
Growth on more than one substrate
When two sugars are available, many organisms use them one after the other, preferring the one that supports faster growth. The growth curve then shows two exponential phases separated by a short lag while the cells switch on the enzymes for the second sugar, a pattern called diauxic growth. In corn mash, glucose dominates, but in cellulosic feedstocks discussed in lesson 12, xylose from hemicellulose is a large share of the sugar, and ordinary yeast cannot ferment it at all. Engineered strains that use xylose, and that do not wait until glucose is gone, are one of the keys to cellulosic ethanol. Mixed substrates make simple Monod models less reliable, and engineers fit separate terms for each sugar when the data justify it.
Measured growth constants carry the conditions in which they were measured. Rosa reminds Theo that a yeast's \(\mu_{max}\) in a clear laboratory medium at 30 °C may be a third higher than in a plant mash with 30 % solids, organic acids and recycled backset, and that the same strain can behave differently from one season's corn to the next. She keeps a small set of reference fermentations, run every month with plant mash and a reference yeast, so that changes in the corn, water or backset show up as changes in the reference curve, separate from changes caused by new yeast or enzymes. Theo adopts the same idea for his model: its constants are refitted each quarter to the reference runs, and the fitted values are logged so trends can be seen.
Cell death also deserves a term in longer simulations. Late in fermentation, when ethanol is high and sugar is gone, viability falls, and dead cells contribute nothing to maintenance or fermentation. A first-order death term, \(r_d = k_d X_v\), applied to the viable cells, describes this adequately; plants see viability fall from above 90 % at peak to perhaps 60 to 80 % at drop in a healthy batch, and much lower in a stuck one.
Common mistakes
MistakeUsing optical density to measure yeast in corn mash.
InsteadThe solids interfere; count cells and measure viability.
MistakeAssuming growth and ethanol production stop together.
InsteadNon-growing yeast continue to ferment for many hours.
MistakeIgnoring maintenance in long fermentations.
InsteadMaintenance consumes substrate and makes ethanol after growth stops.
MistakeFitting \(\mu\) from data outside the exponential phase.
InsteadUse only the straight part of the \(\ln X\) plot.
Summary and key terms
- Batch cultures pass through lag, exponential, deceleration, stationary and death phases.
- Exponential growth follows \(X = X_0 e^{\mu t}\); plant yeast grows at about 0.39 h⁻¹.
- The Monod equation describes substrate limitation; ethanol inhibition is added with a \((1 - P/P_{max})^n\) factor.
- Pirt's maintenance term accounts for substrate used without growth.
- A simple model matches plant data once glucose release from dextrins is included.
- Specific growth rate
- Rate of cell formation per unit mass of cells.
- Doubling time
- Time for the cell concentration to double; \(\ln 2/\mu\).
- Monod equation
- Empirical relation between growth rate and limiting substrate.
- Yield coefficient
- Mass of cells (or product) formed per mass of substrate consumed.
- Maintenance coefficient
- Substrate consumed per unit cell mass per hour without growth.
- Viability
- Fraction of cells that are alive.
Practice problems
Work each problem on paper first, then reveal the answer to check.
How long do cells growing at \(\mu = 0.3\) h⁻¹ take to increase tenfold?
Show answer
\(\ln 10/0.3 = 7.7\) h.
At \(S = K_s\), what is \(\mu\)?
Show answer
Half of \(\mu_{max}\).
With \(P_{max} = 110\) g/L and \(n = 1\), what fraction of \(\mu\) remains at 55 g/L?
Show answer
Half.
What does a stuck fermentation mean?
Show answer
It stops before the sugar is used.
Why is methylene blue used?
Show answer
Live cells reduce it and stay clear; dead cells stain.
Why does a hot fermenter finish with residual sugar?
Show answer
Ethanol tolerance falls with temperature.
Lesson quiz · 5 questions
Score 60% or more to complete this lesson.
Create a free account to save your progress, take quizzes and earn a certificate.