
CHE-260 · Lesson 9 of 12 · 22 min
Gas chromatography
The most important measurement on a fuel ethanol certificate, the ethanol content itself, comes from a gas chromatograph, along with the methanol content and the profile of higher alcohols, the fusel oils, that tell the plant how its fermentation and distillation are running. At Kingfisher Bioenergy, two gas chromatographs run around the clock, and a third analyzes the purity of the carbon dioxide sold to the neighboring gas company. Gas chromatography separates the volatile components of a mixture and measures each one, and it is the single most useful instrument in a fuel lab. Theo spends two weeks learning it from senior technician Dev Raman.
How chromatography separates
All chromatography works the same way. A mobile phase carries the sample through a column containing a stationary phase. Each component distributes itself between the two phases according to its affinity for each. Components that spend more time in the stationary phase move more slowly and leave the column later. If the affinities differ enough, the components emerge one after another as separate bands, and a detector at the end records each band as a peak on a chromatogram. In gas chromatography (GC) the mobile phase is an inert carrier gas and the stationary phase is a thin liquid film coating the inside of a long, narrow column.
The equilibrium for each compound is described by its partition coefficient \(K = c_s/c_m\), the ratio of its concentrations in the stationary and mobile phases. In GC, K depends mainly on the compound's volatility and on how strongly it interacts with the stationary phase: dispersion forces with nonpolar phases, and also dipole forces and hydrogen bonding with polar phases. Lowering the temperature increases K for every compound, so compounds stay in the column longer.
The parts of a gas chromatograph
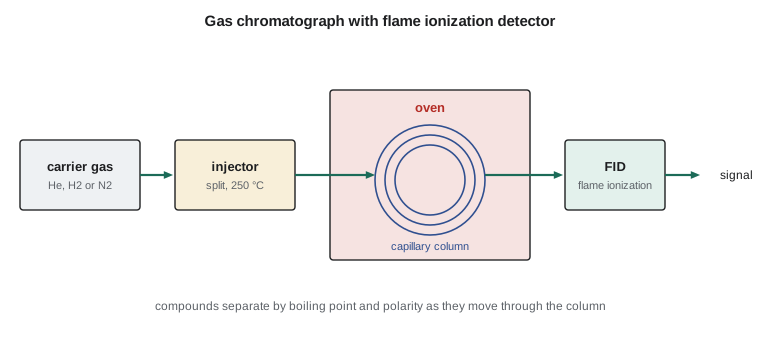
The carrier gas, usually helium or hydrogen, flows at a controlled rate. Helium has been the traditional choice, but recurring helium shortages and rising prices have led many labs to switch to hydrogen, which gives faster separations with little loss of resolution, or to nitrogen for less demanding work. Hydrogen requires leak checks and safety interlocks, because it is flammable.
The injector vaporizes the sample. A microliter or less is injected through a rubber septum into a heated glass liner, typically at 250 °C. Capillary columns hold only a tiny amount of sample, so most injections are split: only a fraction, say 1 part in 100, enters the column, and the rest is vented. For trace analysis, splitless injection sends nearly all the sample onto the column. Headspace sampling, which heats a sealed vial and injects only the vapor above the sample, is ideal for volatile compounds in dirty matrices, such as ethanol in fermenter beer or residual solvents in a product, because the nonvolatile solids never reach the column.
The column is the heart of the instrument. Modern columns are fused silica capillaries 15 to 60 m long, with an internal diameter of 0.25 to 0.53 mm, coated inside with a film of stationary phase 0.1 to 5 µm thick. Nonpolar phases such as polydimethylsiloxane separate compounds roughly by boiling point. Polar phases such as polyethylene glycol (wax columns) retain alcohols, acids and other polar compounds strongly, which is why fuel ethanol methods use polar columns to separate methanol, ethanol and the higher alcohols cleanly.
The oven controls the column temperature to within a fraction of a degree. In isothermal runs the temperature stays constant. In temperature-programd runs it rises at a set rate, for example from 40 to 220 °C at 10 °C per minute. Early-eluting volatile compounds are separated at low temperature, and later, less volatile compounds are pushed out at higher temperature, so a wide range of compounds elutes as sharp peaks in a reasonable time.
Detectors
| Detector | Responds to | Typical use |
|---|---|---|
| Flame ionization (FID) | Organic carbon burned in a hydrogen flame | Alcohols, hydrocarbons, most organics |
| Thermal conductivity (TCD) | Any compound that changes the gas's thermal conductivity | Permanent gases, water, carbon dioxide purity |
| Electron capture (ECD) | Electronegative compounds such as halogens | Trace halogenated pesticides and solvents |
| Mass spectrometer (MS) | Ions formed from each compound, separated by mass | Identifying unknowns, trace confirmation |
| Sulfur chemiluminescence | Sulfur compounds only | Trace sulfur species in fuels and gases |
The flame ionization detector is the standard for organic compounds. The column effluent is burned in a small hydrogen-air flame, which produces ions from carbon atoms in proportion to their number. An electrode collects the ions as a tiny current. The FID responds to almost all organic compounds, ignores water, air and carbon dioxide, and is linear over about seven orders of magnitude, so it can measure ethanol at 95 percent and methanol at 0.01 percent in the same run. Its response per gram varies somewhat between compounds, depending mainly on how much carbon they contain and whether it is bonded to oxygen, so accurate work uses response factors measured with standards.
Retention, efficiency and resolution
Each compound's retention time \(t_R\) is the time from injection to the top of its peak. Retention time identifies a compound only under fixed conditions, and only by comparison with a standard run the same way. The retention factor \(k = (t_R - t_M)/t_M\), where \(t_M\) is the time for an unretained compound, measures how strongly the compound is held. The selectivity \(\alpha = k_2/k_1\) measures how differently the column holds two compounds.
Column efficiency is described by the number of theoretical plates N, which measures how narrow a peak is relative to its retention time. With \(w_{1/2}\) the peak width at half height:
where H, the plate height, lets columns of different length L be compared. A good capillary column gives a few thousand plates per meter. Resolution, the degree of separation of two neighboring peaks, combines both ideas:
A resolution of 1.5 or more means the peaks are separated to baseline, which is the usual goal for quantitative work. Resolution can be improved by increasing efficiency (a longer or narrower column), increasing selectivity (a different stationary phase or temperature) or increasing retention (a lower temperature or thicker film). Of these, selectivity is the most powerful, which is why choosing the right stationary phase matters so much.
Worked problem
Plates and resolution from a chromatogram
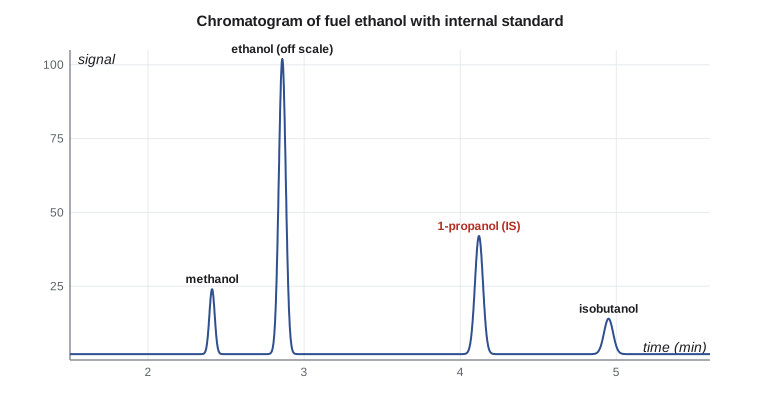
On Theo's fuel ethanol run, methanol elutes at 2.41 min with a half-height width of 0.040 min, and ethanol at 2.86 min with a width of 0.052 min. Find the plate number for methanol and the resolution of the pair.
Show solution
- Methanol plates: \(N = 5.54 \times (2.41/0.040)^2 = 5.54 \times 3630 = 20{,}100\).
- Resolution: \(R_s = 1.18 \times (2.86 - 2.41)/(0.040 + 0.052) = 1.18 \times 0.45/0.092 = 5.8\).
Answer: The column gives about 20,000 plates for methanol and a resolution of 5.8, far more than the 1.5 needed, so the small methanol peak is well separated from the huge ethanol peak beside it.
Reading and troubleshooting chromatograms
A chromatogram tells an experienced analyst about the health of the instrument as well as the sample. Ideal peaks are narrow and symmetric. Tailing peaks, which rise sharply and fall slowly, often mean active sites in a dirty liner or the front of the column are holding polar compounds such as alcohols and acids; replacing the liner and trimming a short length from the column inlet usually cures them. Fronting peaks, which rise slowly and fall sharply, usually mean the column is overloaded, so the split ratio is raised or the sample diluted.
| Symptom | Likely cause | Usual fix |
|---|---|---|
| Tailing alcohol peaks | Active sites in a dirty liner or column inlet | Replace the liner, trim the column |
| Fronting peaks | Too much sample on the column | Increase the split ratio or dilute |
| Retention times drifting | Carrier gas leak or flow change | Leak-check fittings and the septum |
| Ghost peaks in blanks | Carryover or a bleeding septum | Run solvent blanks, replace the septum |
| Rising baseline at high temperature | Stationary phase bleeding from the column | Condition or replace the column |
Because retention times shift slowly as a column ages, the lab runs a standard at the start of each sequence and lets the data system adjust its identification windows. It also runs a solvent blank after any unusually concentrated sample, so that carryover cannot appear as a false peak in the next customer sample.
Quantitative analysis
Peak area is proportional to the amount of each compound reaching the detector, and modern data systems integrate the areas automatically. Three approaches turn areas into concentrations. Area normalization assumes every component is detected with the same response and reports each area as a percentage of the total; it is quick but rarely accurate. External standard calibration compares sample areas with those of standards injected separately; it depends on reproducible injection volumes, which manual injection rarely achieves. The internal standard method adds a known amount of a compound not present in the sample, chosen to elute in a clear part of the chromatogram, to every standard and sample. Concentrations are calculated from the ratio of analyte area to internal standard area, which cancels variations in injection volume and detector response.
With an internal standard, a relative response factor is measured from a standard of known composition:
Standard test methods for fuel ethanol, such as the one ASTM D4806 cites for ethanol and methanol content, use exactly this approach, with specified columns, conditions and internal standards so that results from different labs agree. The program below calculates plate numbers and resolution for Theo's run and quantifies methanol with 1-propanol as the internal standard.
# Gas chromatography: plate number, resolution and internal-standard quantitation
import math
# Peaks from a fuel ethanol run on a polar capillary column (retention time and width at half height, min)
peaks = {'methanol': (2.41, 0.040), 'ethanol': (2.86, 0.052), '1-propanol (IS)': (4.12, 0.060), 'isobutanol': (4.95, 0.068)}
for name, (tr, w) in peaks.items():
    N = 5.54 * (tr / w) ** 2
    print(f"{name:16s} tR = {tr:.2f} min, N = {N:,.0f} plates")

def resolution(p1, p2):
    (t1, w1), (t2, w2) = p1, p2
    return 1.18 * (t2 - t1) / (w1 + w2)
print(f"resolution methanol/ethanol = {resolution(peaks['methanol'], peaks['ethanol']):.1f}")

# Internal standard method: response factor from a standard, then the sample
# standard: methanol 0.500 vol%, IS 1.00 vol%; areas
A_m_std, A_is_std = 15420, 30110
RF = (A_m_std / 0.500) / (A_is_std / 1.00)
# sample spiked with the same IS amount
A_m, A_is = 9875, 30480
conc = A_m / A_is / RF * 1.00
print(f"relative response factor = {RF:.3f}")
print(f"methanol in sample = {conc:.3f} vol%")methanol tR = 2.41 min, N = 20,111 plates ethanol tR = 2.86 min, N = 16,758 plates 1-propanol (IS) tR = 4.12 min, N = 26,122 plates isobutanol tR = 4.95 min, N = 29,356 plates resolution methanol/ethanol = 5.8 relative response factor = 1.024 methanol in sample = 0.316 vol%
The internal standard result of 0.316 percent methanol agrees with the calibration-line result of 0.318 percent from Lesson 3, within the method's precision, which is the kind of independent check the lab looks for when a new analyst runs a method for the first time.
Gas chromatography beyond the fuel specification
The same instruments answer many process questions. The fusel oil profile, mainly 1-propanol, isobutanol and isoamyl alcohol, rises when yeast is stressed by high temperature or nutrient shortages, so trends in the higher alcohols warn the fermentation team early. Acetaldehyde and ethyl acetate peaks show how well the distillation is removing light impurities. A thermal conductivity detector on a separate instrument measures the carbon dioxide purity and the traces of oxygen, nitrogen and other gases in the gas sold for liquefaction, and a sulfur-specific detector checks for sulfur compounds that would make the gas unsuitable for food and beverage use. Coupling the chromatograph to a mass spectrometer, covered in Lesson 11, turns retention times into confident identifications.
Common mistakes
MistakeIdentifying a peak by its retention time alone.
InsteadRetention time matches only suggest identity; confirm with a standard run under the same conditions or with a mass spectrum.
MistakeUsing area percent as if every compound gave the same response.
InsteadDetector response varies; use response factors with an internal or external standard.
MistakeChoosing an internal standard that elutes on top of another peak.
InsteadPick a compound absent from the samples that elutes in a clear region of the chromatogram.
MistakeRaising flow or temperature to save time without checking resolution.
InsteadVerify that critical pairs, such as methanol and ethanol, still meet the required resolution.
Summary and key terms
- Chromatography separates compounds by their different partitioning between a mobile and a stationary phase.
- A GC has a carrier gas, injector, capillary column in an oven, and detector; temperature programming handles wide volatility ranges.
- Polar wax columns separate alcohols well; nonpolar columns separate mainly by boiling point.
- The FID responds to organic carbon over a very wide linear range; the TCD measures permanent gases.
- Plate number measures efficiency, and resolution of 1.5 or more gives baseline separation.
- Internal standard calibration with response factors gives the most reliable GC quantitation.
- Mobile phase
- The fluid that carries the sample through a chromatographic column.
- Stationary phase
- The phase fixed in the column, with which sample components interact.
- Retention time
- The time from injection to the maximum of a compound's peak.
- Theoretical plates
- A measure of column efficiency based on peak width relative to retention time.
- Resolution
- A measure of how completely two neighboring peaks are separated.
- Temperature programming
- Raising the column temperature during a run to elute compounds of different volatility.
- Flame ionization detector
- A GC detector that measures ions produced when organic compounds burn in a hydrogen flame.
- Headspace sampling
- Injecting only the vapor above a heated sample in a sealed vial.
Practice problems
Work each problem on paper first, then reveal the answer to check.
A peak has tR = 6.20 min and half-height width 0.10 min. Find N.
Show answer
\(5.54 \times (62)^2 = 21{,}300\) plates.
A 30 m column gives 90,000 plates. What is its plate height?
Show answer
\(30{,}000\ \text{mm}/90{,}000 = 0.33\) mm.
Two peaks at 3.10 and 3.25 min have half-height widths of 0.05 min each. What is their resolution?
Show answer
\(1.18 \times 0.15/0.10 = 1.8\), baseline separated.
Why does an FID suit fuel ethanol analysis?
Show answer
It responds to organic compounds over a very wide range, so major ethanol and trace methanol are measured together, and it ignores water.
Why use headspace injection for ethanol in fermenter beer?
Show answer
Only the vapor is injected, so yeast, sugars and solids never reach the column.
An internal standard method has RF = 1.05. A sample gives Ax/AIS = 0.42 with cIS = 1.00 vol%. What is cx?
Show answer
\(0.42 \times 1.00/1.05 = 0.40\) vol%.
Lesson quiz · 5 questions
Score 60% or more to complete this lesson.
Create a free account to save your progress, take quizzes and earn a certificate.