
CHE-260 · Lesson 2 of 12 · 22 min
Sampling and sample preparation
A feed buyer has complained. The certificate of analysis for a truckload of dried distillers grains from Kingfisher Bioenergy said 30.4 percent protein on a dry basis, and the buyer's own lab found 29.1 percent. A difference of 1.3 percentage points sounds small, but feed is sold on protein, and on a 25-metric ton load the gap is worth real money. Marisol asks Theo to find out which number is right. He soon discovers that both labs ran the protein measurement correctly. The difference came from the samples: what was scooped from where, and what happened to it before it reached the instrument.
This lesson covers the steps before measurement, which are where most analytical errors arise. A measurement of a few grams can only describe a truckload, a railcar or a fermenter if those grams were chosen and handled so that they represent the whole. Analysts sometimes say that an analysis is never better than its sample.
Populations, lots and samples
The material a decision is about is called the population or lot: one truckload of grains, one railcar of ethanol, one fermenter batch, one day's effluent. The analyst cannot test all of it, so a sample is taken. A representative sample has the same composition as the lot, within the accuracy needed. Getting there usually involves several stages. Increments are small portions taken from different places or times in the lot. They are combined into a gross or composite sample, which is reduced by mixing and dividing to a laboratory sample of manageable size. Finally the analyst weighs out a test portion, often only a gram or two, for the measurement.
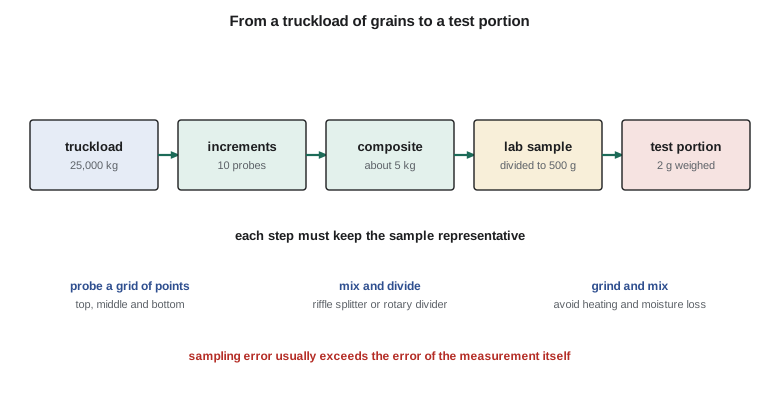
The challenge is different for each kind of material. Liquids that are well mixed, such as finished ethanol in a circulating tank, are easy: one sample from the right place represents the lot. Liquids that stratify, such as a storage tank that has stood for days, need samples from the top, middle and bottom, combined in proportion. Solids are hardest because particles differ. Kernels of corn, flakes of grain and fines differ in composition and settle differently when a truck is shaken on the road. Gases and vapors in process lines may change minute by minute, so the time of sampling matters as much as the place.
Sampling plans and standard practices
A sampling plan states where, when, how and how much to sample, and who does it. Many plans follow published standards. Grain is commonly sampled with a probe pushed vertically through the load at a pattern of points; Canadian and US grain inspection rules and feed industry guidelines set the number of probes and their locations. Petroleum and fuel ethanol sampling follows standard practices for tanks, railcars and pipelines, which specify the sample containers, the levels to sample and the way to avoid contaminating or evaporating the sample. Water and wastewater sampling follows the plant's permit and the analytical methods it names, which set container types, preservatives and holding times.
| Material | Sampling approach | Main risk |
|---|---|---|
| Grain in a truck | Vertical probes at a grid of points, top to bottom | Fines and heavy kernels settle unevenly |
| Dried distillers grains | Increments from the conveyor at timed intervals | Segregation by particle size |
| Fuel ethanol in a tank | Top, middle and bottom samples, or a running sample | Water and denaturant can stratify |
| Fermenter beer | Sample valve after flushing the dead leg | Old liquid in the sample line |
| Effluent | Flow-proportional composite over 24 hours | Concentrations vary through the day |
Random sampling means every part of the lot has an equal chance of being chosen, which protects against hidden patterns. Systematic sampling takes increments at regular intervals in space or time, which is practical and usually adequate if the interval does not match some cycle in the process. Stratified sampling divides the lot into layers or periods and samples each one, which is right when the lot is known to vary, for example a truck that was loaded from two different bins.
Sampling error and analysis error
Every result carries error from the sampling and error from the analysis. If the two are independent, their variances add:
Because the variances add, the larger one dominates. Improving a measurement that is already much more precise than the sampling barely changes the total. If the sampling standard deviation is 0.75 and the analysis standard deviation is 0.17, the total is \(\sqrt{0.75^2 + 0.17^2} = 0.77\). Halving the analysis error to 0.085 would lower the total only to 0.755. Taking more increments is the better investment.
To separate the two parts, the analyst designs a simple experiment: take several increments from one lot and analyze each one twice. The differences between duplicates reveal the analysis error, and the scatter among increment means, after removing the analysis part, reveals the sampling error. Theo did exactly this on a truckload of grains, and the program below shows his calculation.
# Splitting the variance of a DDGS protein result into sampling and analysis parts
import statistics as st

# Five increments taken from one truckload, each tested in duplicate (protein, % dry basis)
data = [(31.2, 31.0), (29.8, 30.1), (30.6, 30.4), (32.0, 31.7), (30.1, 30.3)]
means = [sum(d) / 2 for d in data]
# analysis variance from duplicate differences: s^2 = sum(d^2) / (2k)
s2_anal = sum((a - b) ** 2 for a, b in data) / (2 * len(data))
# variance of increment means contains sampling variance plus half the analysis variance
s2_means = st.variance(means)
s2_samp = max(s2_means - s2_anal / 2, 0)
print(f"analysis s   = {s2_anal ** 0.5:.2f} % protein")
print(f"sampling s   = {s2_samp ** 0.5:.2f} % protein")
share = s2_samp / (s2_samp + s2_anal)
print(f"share of total variance from sampling = {share:.0%}")

# How many increments n (each tested once) are needed so that the standard error
# of the composite mean is below 0.25 % protein?
target = 0.25
for n in range(1, 31):
    se = ((s2_samp + s2_anal) / n) ** 0.5
    if se <= target:
        print(f"increments needed: {n} (standard error {se:.2f})")
breakanalysis s = 0.17 % protein sampling s = 0.75 % protein share of total variance from sampling = 95% increments needed: 10 (standard error 0.24)
Ninety-five percent of the variance came from sampling. The plant's old practice of taking three scoops from the top of each truck was the real cause of the disagreement with the buyer. With ten probes spread through the load, the standard error of the composite falls below 0.25 percent protein.
Increasing the number of increments reduces sampling error because the standard error of a mean falls with the square root of the number of independent increments:
Worked problem
How many increments are needed?
The sampling standard deviation of single increments for moisture in incoming corn is 0.60 percent moisture, and the analysis standard deviation is 0.10 percent. How many increments must be composited, each measured once as part of a well-mixed composite, so that the standard error of the result is no more than 0.20 percent?
Show solution
- Compositing averages the sampling error over n increments, but the composite is measured only once, so the analysis variance is not reduced: \(s^2 = 0.60^2/n + 0.10^2\).
- Require \(\sqrt{0.36/n + 0.01} \le 0.20\), so \(0.36/n \le 0.04 - 0.01 = 0.03\).
- Then \(n \ge 0.36/0.03 = 12\).
Answer: Twelve increments. The analysis error sets a floor: even with infinitely many increments the standard error could not fall below 0.10 percent. If the target were tighter than that, the lab would also need to measure the composite in replicate.
Reducing and dividing the sample
A composite sample of several kilograms must be reduced to a laboratory sample and then a test portion without losing its representativeness. Simply scooping from the top of a bag is not acceptable, because particles of different size separate when the bag is handled. Instead the sample is mixed and divided with a device that gives every particle an equal chance of reaching each fraction. A riffle splitter is a row of alternating chutes that divides a poured sample into two equal halves; repeating the split halves the sample each time. A rotary divider feeds the sample onto a spinning set of containers. Coning and quartering, an older hand method, piles the sample into a cone, flattens it and takes opposite quarters.
Particle size matters too. The coarser the particles, the more material is needed for a test portion to be representative, because each particle carries a larger share of the analyte. Grinding to a fine, uniform size lets a small test portion represent the sample. But grinding generates heat, and heat drives off moisture and can change some components. The plant grinds grains in a mill designed to avoid overheating, and it measures moisture on a separate portion that is not ground, or ground quickly in a sealed mill.
Containers, preservation and holding times
Once taken, a sample must not change before analysis. Liquid samples go into containers that do not react with them or leach into them: glass for organic analytes, plastic for most metals, amber glass for light-sensitive compounds. Fuel ethanol samples are taken in clean, dry containers filled nearly to the top and capped tightly, because ethanol absorbs water from humid air and loses lighter components if the container is left open. Fermenter samples are cooled or treated immediately, because yeast and bacteria keep converting sugars while the sample sits on a bench. Water samples for metals are acidified, samples for biochemical oxygen demand are kept cold and tested within a set holding time, and samples for dissolved gases are filled without headspace.
Every sample needs a label that ties it to its source: the sample point, the date and time, who took it and what tests are needed. For samples that may be used to settle a dispute or show regulatory compliance, the lab keeps a chain-of-custody record that documents every person who handled the sample and when. drinking-water compliance samples must go to a state-certified laboratory.
Preparing samples for measurement
Most instruments need the analyte in a particular form, usually a clear solution of suitable concentration. Sample preparation does that. Solids may be dried, ground, weighed and dissolved. Organic material such as distillers grains may be digested in hot acid to free metals for the plasma instrument, or extracted with a solvent to measure fat. Liquids may be filtered to remove yeast and solids, diluted to bring the concentration into the instrument's working range, or have an internal standard added. Each step is a chance for loss, contamination or error, so each is controlled.
| Step | Purpose | Common error |
|---|---|---|
| Drying | Report results on a dry basis | Incomplete drying or decomposition from overheating |
| Grinding | Make small portions representative | Moisture loss, contamination from the mill |
| Weighing | Know the exact amount taken | Drafts, static, warm samples on the balance |
| Dissolving or digesting | Get the analyte into solution | Incomplete digestion, losses of volatile elements |
| Filtering | Remove particles that block instruments | Analyte adsorbing on the filter |
| Diluting | Bring concentration into range | Wrong glassware, wrong dilution factor recorded |
Contamination deserves special care when the analyte is present at trace levels. Copper in fuel ethanol is specified at a fraction of a milligram per kilogram, so a sample bottle rinsed with tap water, a brass fitting or a dusty pipette tip can add more copper than the sample contains. Trace work uses acid-washed plastic containers, high-purity water and reagents, and reagent blanks carried through the whole procedure so that any contamination is measured and subtracted.
Losses are the opposite problem. Volatile analytes evaporate from open containers, analytes adsorb onto glass or filter paper, and a few drops left on the walls of a flask during transfer can matter when the sample is small. A recovery check, in which a known amount of analyte is added to a sample and carried through the procedure, measures how much is lost. Recoveries between about 90 and 110 percent are typical acceptance limits for many routine methods.
Common mistakes
MistakeScooping a sample from the top of a truck or bag.
InsteadProbe a grid of points through the full depth; particles segregate during transport.
MistakeBuying a more precise instrument to fix scattered results.
InsteadFind which error dominates first; sampling error is usually larger and is fixed with more increments.
MistakeLeaving a fuel ethanol sample bottle open on the bench.
InsteadCap it tightly at once; ethanol absorbs moisture and loses volatile components.
MistakeDrawing a fermenter sample without flushing the sample line.
InsteadFlush the dead leg first so the sample comes from the vessel, not the line.
Summary and key terms
- A lot is represented by increments, combined into a composite, divided to a laboratory sample and weighed as a test portion.
- Sampling and analysis variances add; the larger one dominates the total uncertainty.
- The standard error of a composite falls with the square root of the number of increments.
- Divide samples with riffle splitters or rotary dividers, and grind without overheating.
- Choose containers, preservation and holding times that keep the sample unchanged, and label every sample.
- Use blanks to measure contamination and spike recoveries to measure losses.
- Lot
- The whole quantity of material that a sampling decision is about.
- Increment
- A single portion taken from one place or time in a lot.
- Composite sample
- A sample made by combining increments.
- Test portion
- The amount of sample actually weighed or measured for one analysis.
- Representative sample
- A sample whose composition matches that of the lot within the required accuracy.
- Riffle splitter
- A device of alternating chutes that divides a granular sample into two equal parts.
- Chain of custody
- A record of everyone who handled a sample, used when results may be disputed or reported to a regulator.
- Spike recovery
- The percentage of a known added amount of analyte that is found after the full procedure.
Practice problems
Work each problem on paper first, then reveal the answer to check.
Sampling and analysis standard deviations are 0.40 and 0.30. What is the total standard deviation?
Show answer
\(\sqrt{0.16 + 0.09} = 0.50\).
In the same case, which improvement helps more: halving sampling error or halving analysis error?
Show answer
Halving sampling error gives \(\sqrt{0.04+0.09} = 0.36\); halving analysis error gives \(\sqrt{0.16+0.0225} = 0.43\). Sampling helps more.
How many times must a 4 kg composite be split in a riffle splitter to reach about 500 g?
Show answer
Three times: 4 kg, 2 kg, 1 kg, 0.5 kg.
Why are ethanol samples filled nearly to the top of the bottle?
Show answer
To limit headspace, so less water is absorbed from air and fewer volatile components evaporate.
A sample spiked with 0.50 mg/L copper reads 0.47 mg/L higher than the unspiked sample. What is the recovery?
Show answer
\(0.47/0.50 = 94\) percent.
What is a stratified sampling plan, and when is it appropriate?
Show answer
Sampling each known layer or period separately; appropriate when the lot is known to vary, such as a stratified tank or a truck loaded from two bins.
Lesson quiz · 5 questions
Score 60% or more to complete this lesson.
Create a free account to save your progress, take quizzes and earn a certificate.