
CHE-260 · Lesson 7 of 12 · 24 min
Infrared, near-infrared and Raman spectroscopy
A drum of cleaning solvent at Kingfisher Bioenergy has lost its label, and maintenance wants to know whether it can go back into service. Marisol hands Theo a few drops and asks him to identify it before lunch. He places a drop on the crystal of the lab's infrared spectrometer, and thirty seconds later he has a spectrum with a strong band near 1740 cm⁻¹ and another near 1240 cm⁻¹: an ester, almost certainly ethyl acetate, which a library search confirms. Infrared spectroscopy identifies compounds by the vibrations of their bonds, and its near-infrared cousin measures moisture, protein and oil in grain in seconds at the receiving pit. This lesson explains how both work.
Molecular vibrations
The atoms in a molecule are not fixed. Bonds stretch and compress, and bond angles bend, like masses joined by springs. Each kind of motion has a characteristic frequency, and molecules absorb infrared light of exactly that frequency. Infrared spectra are plotted against wavenumber \(\tilde{\nu} = 1/\lambda\), in reciprocal centimeters, which is proportional to frequency and energy. The mid-infrared region from about 4000 to 400 cm⁻¹ (wavelengths of 2.5 to 25 µm) contains the fundamental vibrations of most organic molecules.
A simple model treats a bond as a harmonic oscillator. Its vibrational wavenumber depends on the bond's force constant k, a measure of stiffness, and the reduced mass \(\mu = m_1 m_2/(m_1 + m_2)\):
Two predictions follow. Stiffer bonds vibrate at higher wavenumbers, so a carbon-carbon triple bond absorbs near 2200 cm⁻¹, a double bond near 1650 cm⁻¹ and a single bond near 1000 cm⁻¹. Lighter atoms vibrate faster, so bonds to hydrogen, O–H, N–H and C–H, appear at the high end of the spectrum, between 2800 and 3700 cm⁻¹. Replacing hydrogen with deuterium lowers a C–H stretch by a factor of about \(\sqrt{2}\), a test chemists use to assign bands.
Not every vibration absorbs infrared light. The selection rule is that the vibration must change the molecule's dipole moment. Polar bonds such as O–H and C=O give strong bands. Symmetric vibrations of nonpolar bonds, such as the stretch of the N≡N bond in nitrogen or the symmetric stretch of carbon dioxide, give none, which is why the nitrogen and oxygen in air do not interfere with infrared measurements while water vapor and carbon dioxide do.
Group frequencies and the fingerprint region
Functional groups absorb in predictable regions whatever the rest of the molecule looks like, which makes infrared spectroscopy a powerful tool for identifying them. The region above about 1500 cm⁻¹ holds most of these group frequencies. Below 1500 cm⁻¹, many bending and skeletal vibrations overlap to give a complex pattern unique to each compound, the fingerprint region, which is compared with library spectra to confirm identity.
| Group | Wavenumber (cm⁻¹) | Appearance |
|---|---|---|
| O–H in alcohols (hydrogen bonded) | 3200 to 3550 | Strong, broad |
| O–H in carboxylic acids | 2500 to 3300 | Very broad |
| N–H in amines and amides | 3300 to 3500 | Medium, sharper than O–H |
| C–H in alkanes | 2850 to 2970 | Strong, sharp |
| C=O in esters | About 1735 to 1750 | Very strong |
| C=O in ketones and acids | About 1700 to 1725 | Very strong |
| C=C in alkenes and aromatics | 1450 to 1650 | Medium to weak |
| C–O in alcohols, ethers and esters | 1000 to 1300 | Strong |
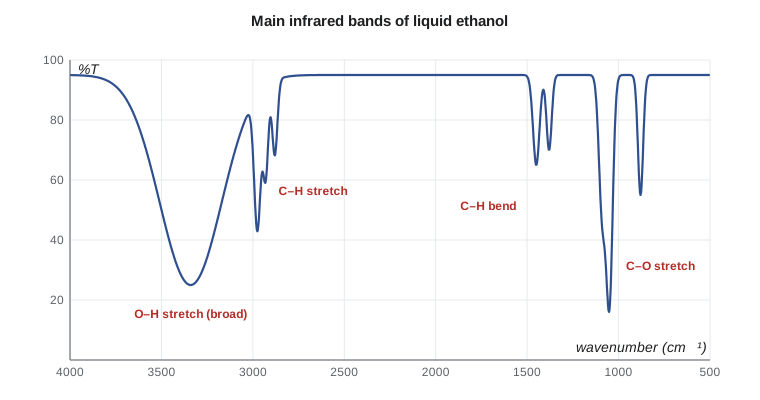
Ethanol's spectrum shows the pattern clearly: a broad, strong O–H stretch centerd near 3340 cm⁻¹, broadened because molecules form hydrogen bonds of many different strengths; sharp C–H stretches near 2900 to 2975 cm⁻¹; C–H bends near 1450 and 1380 cm⁻¹; and a strong C–O stretch near 1050 cm⁻¹. Ethyl acetate, the mystery solvent, lacks the O–H band but has the unmistakable ester carbonyl near 1740 cm⁻¹ and C–O stretches near 1240 and 1050 cm⁻¹. Acetic acid, a fermentation by-product, shows a carbonyl near 1710 cm⁻¹ and an extremely broad O–H band that runs from 2500 to 3300 cm⁻¹.
Worked problem
Identifying a contaminant
A sample of fuel ethanol from a railcar has an unusual odor. Its infrared spectrum looks like ethanol except for a new weak band at 1740 cm⁻¹ and a slightly stronger absorption near 1240 cm⁻¹. What is the likely contaminant, and what should the lab do next?
Show solution
- A band near 1740 cm⁻¹ is a carbonyl, and with a C–O band near 1240 cm⁻¹ it points to an ester.
- Ethyl acetate is the most likely ester: fermentation makes small amounts, and it is used as a cleaning solvent.
- Infrared spectroscopy identifies the class but quantifies trace components poorly in a strongly absorbing matrix.
Answer: Ethyl acetate is the probable contaminant. The lab confirms and measures it by gas chromatography (Lesson 9), then checks whether the railcar was cleaned with solvent before loading.
Fourier transform infrared spectrometers
Older infrared instruments scanned through wavelengths with a grating, one at a time. Modern Fourier transform infrared (FTIR) spectrometers measure all wavelengths at once with a Michelson interferometer. A beam splitter divides the infrared beam into two paths, one reflected from a fixed mirror and one from a moving mirror. When the beams recombine they interfere, and as the moving mirror travels, the detector records an interferogram, a signal that contains every wavelength encoded as a different oscillation. A computer applies a Fourier transform to convert the interferogram into a spectrum.
FTIR has three big advantages. Because all wavelengths are measured at once, a full spectrum takes about a second, so many scans can be averaged to improve the signal-to-noise ratio. Because there are no narrow slits, much more light reaches the detector. And because a laser measures the mirror position, the wavenumber scale is extremely accurate, which makes library searching reliable.
Sampling methods
The way the sample is presented matters as much as the instrument. Attenuated total reflectance (ATR) has made infrared analysis of liquids and solids almost effortless. The sample is pressed against a crystal of diamond, zinc selenide or germanium. The infrared beam reflects inside the crystal, and at each reflection it penetrates a micrometer or two into the sample, so strongly absorbing samples such as water and ethanol can be measured without any preparation. Older methods used thin liquid cells with salt windows, or solids ground with potassium bromide and pressed into a transparent pellet. Gases are measured in long-path cells, often with mirrors that fold the light path to several meters.
Quantitative infrared and near-infrared
The Beer-Lambert law applies to infrared absorption, so band absorbances can be used for quantitative work, although overlapping bands and short path lengths make it less straightforward than in the ultraviolet and visible. Infrared methods are standard for measuring ethanol and other oxygenates in finished gasoline, for example, and for monitoring water in solvents.
The near-infrared (NIR) region, from about 780 to 2500 nm, contains overtones and combinations of the fundamental vibrations, mostly of bonds to hydrogen. These bands are weak and broad, which sounds like a disadvantage but is actually useful: light penetrates deep into samples, so grain, flour and distillers grains can be measured whole or ground, without dissolving or diluting, in under a minute. Because the bands overlap heavily, NIR does not use single-band calibrations. Instead, instruments are calibrated with hundreds of samples analyzed by reference methods, such as oven moisture, combustion protein and solvent-extracted fat, and a multivariate statistical model, usually partial least squares regression, learns the relation between the whole spectrum and each property.
At Kingfisher Bioenergy, an NIR analyzer at the grain receiving station measures moisture, protein, oil and starch in each truck of corn in about thirty seconds, which sets the price paid and flags trucks that need further testing. A second analyzer checks distillers grains before loadout. The QC lab's job is to keep these analyzers honest: it runs reference analyzes on a set of samples every week and compares them with the NIR results, and it adds new samples to the calibration when the crop or the process changes.
Worked problem
Checking the grain analyzer against reference results
Each week the lab measures moisture in five corn samples by the reference oven method and compares the results with the NIR analyzer. This week the oven results are 15.2, 14.1, 16.8, 13.5 and 15.9 percent, and the NIR results are 15.5, 14.5, 17.0, 13.9 and 16.2 percent. Is the analyzer biased, and how large is its prediction error?
Show solution
- Differences (NIR minus oven): 0.3, 0.4, 0.2, 0.4 and 0.3 percent. Their mean, the bias, is 0.32 percent.
- The standard deviation of the differences is about 0.08 percent, so the scatter is small and consistent.
- The root-mean-square difference, which combines bias and scatter, is \(\sqrt{(0.09+0.16+0.04+0.16+0.09)/5} = 0.33\) percent.
Answer: The analyzer reads about 0.3 percent high with very little scatter, so most of its error is bias. The lab applies a bias correction, confirms it with the next week's samples and records the change. A large scatter, by contrast, would mean the model itself needed new calibration samples.
A moisture bias of 0.3 percent sounds trivial, but corn is bought on a moisture basis, with price discounts and drying charges that rise with every point of moisture above the trading standard. Across a year of deliveries, an analyzer that reads 0.3 percent high would overcharge growers significantly, and growers have a right to accurate weights and grades. That is why grain analyzers used in trade are certified and inspected by the federal grain authority, and why the lab's weekly check is part of the plant's quality system.
The program below converts between wavelength and wavenumber, estimates stretching wavenumbers from the harmonic-oscillator model, and fits a simple near-infrared calibration of a water-band absorbance ratio against Karl Fischer water results.
# Infrared: wavelength and wavenumber, and water in ethanol from an absorbance ratio
# 1. Converting between wavelength and wavenumber
for um in (2.94, 3.4, 5.8, 9.5):
    print(f"{um:4.2f} um = {1e4 / um:6.0f} cm-1")

# 2. Harmonic oscillator estimate of a bond's stretching wavenumber
import math
c = 2.998e10          # speed of light, cm/s
amu = 1.6605e-27
def wavenumber(k, m1, m2):
    mu = m1 * m2 / (m1 + m2) * amu
    return math.sqrt(k / mu) / (2 * math.pi * c)
print(f"O-H stretch (k = 770 N/m): {wavenumber(770, 16, 1):.0f} cm-1")
print(f"C-H stretch (k = 500 N/m): {wavenumber(500, 12, 1):.0f} cm-1")
print(f"C=O stretch (k = 1200 N/m): {wavenumber(1200, 12, 16):.0f} cm-1")

# 3. Near-infrared calibration: water band absorbance ratio vs water content (mass %)
water = [0.10, 0.30, 0.50, 0.80, 1.20]
ratio = [0.051, 0.122, 0.196, 0.304, 0.447]
n = len(water); xm = sum(water) / n; ym = sum(ratio) / n
b = sum((x - xm) * (y - ym) for x, y in zip(water, ratio)) / sum((x - xm) ** 2 for x in water)
a = ym - b * xm
print(f"ratio = {a:.4f} + {b:.4f} x water%")
for r in (0.140, 0.260):
print(f"ratio {r:.3f} -> water {(r - a) / b:.2f} mass %")2.94 um = 3401 cm-1 3.40 um = 2941 cm-1 5.80 um = 1724 cm-1 9.50 um = 1053 cm-1 O-H stretch (k = 770 N/m): 3726 cm-1 C-H stretch (k = 500 N/m): 3032 cm-1 C=O stretch (k = 1200 N/m): 1723 cm-1 ratio = 0.0149 + 0.3606 x water% ratio 0.140 -> water 0.35 mass % ratio 0.260 -> water 0.68 mass %
The harmonic model gets the order of magnitude right but overestimates the O–H stretch, because real bonds are anharmonic and hydrogen bonding weakens O–H in liquids. The NIR calibration is a single-variable version of what commercial analyzers do with hundreds of wavelengths; its slope and intercept come from samples measured both ways.
Raman spectroscopy
Raman spectroscopy probes the same vibrations by a different route. A laser illuminates the sample, and a tiny fraction of the scattered light comes back shifted in wavelength by the vibrational energies of the molecule. The selection rule is different: a vibration is Raman active if it changes the molecule's polarizability. Symmetric, nonpolar vibrations that are weak in the infrared, such as C=C and S–S stretches, are strong in Raman, and water, which dominates infrared spectra, is a weak Raman scatterer. That makes Raman useful for aqueous samples and for measuring through glass and plastic containers, so handheld Raman instruments are widely used to verify incoming raw materials without opening the drum.
Common mistakes
MistakeExpecting a symmetric, nonpolar vibration to give a strong infrared band.
InsteadInfrared bands require a change in dipole moment; such vibrations may appear in Raman instead.
MistakeAssigning a compound from the group-frequency region alone.
InsteadConfirm identity by comparing the fingerprint region with a library or reference spectrum.
MistakeTrusting a near-infrared result for a sample unlike those in its calibration.
InsteadNIR models only predict within the range they were built on; check new materials by reference methods.
MistakeUsing infrared spectroscopy to measure a trace contaminant in a strongly absorbing liquid.
InsteadUse it to identify the compound class, then quantify by a more sensitive, selective method such as chromatography.
Summary and key terms
- Infrared light excites bond vibrations; the wavenumber depends on bond stiffness and the masses of the atoms.
- A vibration is infrared active only if it changes the dipole moment.
- Group frequencies identify functional groups; the fingerprint region below 1500 cm⁻¹ identifies the compound.
- FTIR instruments use an interferometer and a Fourier transform to record full spectra quickly and accurately.
- ATR lets liquids and solids be measured with no preparation.
- Near-infrared analyzers with multivariate calibrations measure moisture, protein and oil in grain in seconds.
- Raman spectroscopy complements infrared and works well with water and through containers.
- Wavenumber
- The reciprocal of wavelength, usually in cm⁻¹, proportional to photon energy.
- Force constant
- A measure of a bond's stiffness in the harmonic oscillator model.
- Group frequency
- A characteristic absorption range for a functional group.
- Fingerprint region
- The complex region below about 1500 cm⁻¹ that is unique to each compound.
- Interferometer
- A device that splits and recombines light to produce an interferogram containing all wavelengths.
- Attenuated total reflectance
- A sampling method in which infrared light reflects inside a crystal and probes a thin layer of sample in contact with it.
- Partial least squares
- A multivariate regression method that relates whole spectra to reference values.
- Raman scattering
- Inelastic scattering of light in which the scattered photons are shifted by vibrational energies.
Practice problems
Work each problem on paper first, then reveal the answer to check.
Convert 6.00 µm to wavenumber.
Show answer
\(10^4/6.00 = 1667\) cm⁻¹.
Which bond absorbs at higher wavenumber, C–H or C–D, and why?
Show answer
C–H, because hydrogen is lighter so the reduced mass is smaller.
An unknown liquid shows a strong band at 1715 cm⁻¹ and no O–H band. What group is likely present?
Show answer
A carbonyl, most likely a ketone.
Why does the O–H band of ethanol appear broad?
Show answer
Hydrogen bonds of many different strengths spread the O–H stretch over a range of wavenumbers.
Why is ATR convenient for measuring ethanol?
Show answer
The beam penetrates only a micrometer or two, so a drop on the crystal can be measured without dilution or a thin cell.
Why must an NIR grain analyzer be checked against reference methods?
Show answer
Its prediction is a statistical model; drift, new crops or process changes can make it inaccurate.
Lesson quiz · 5 questions
Score 60% or more to complete this lesson.
Create a free account to save your progress, take quizzes and earn a certificate.