
CHE-260 · Lesson 10 of 12 · 24 min
Liquid chromatography and ion chromatography
Every few hours, fermentation technicians at Kingfisher Bioenergy bring the QC lab a small tube of beer from each fermenter. Within twenty minutes the lab reports glucose, maltose and longer sugars, lactic and acetic acid, glycerol and ethanol. Those numbers tell the fermentation team whether the yeast is healthy, whether starch is being broken down fast enough and whether bacteria are stealing sugar to make lactic acid. Sugars and organic acids do not vaporize without decomposing, so gas chromatography cannot measure them. Liquid chromatography can. This lesson covers high-performance liquid chromatography (HPLC), the theory of column efficiency it shares with GC, and ion chromatography, which measures the chloride and sulfate limited in fuel ethanol.
Why liquid chromatography
In liquid chromatography the mobile phase is a liquid pumped through a column packed with small particles. Because nothing needs to vaporize, LC handles sugars, organic acids, proteins, vitamins, pesticides, mycotoxins and other compounds that are nonvolatile, polar or easily damaged by heat. Separation depends on interactions with both the stationary and the mobile phase, so changing the mobile phase composition is a powerful way to control retention, something GC cannot do.
Early liquid chromatography used large particles and gravity flow and took hours. Modern HPLC uses particles of 2 to 5 µm in steel columns 50 to 250 mm long, with high-pressure pumps delivering 0.2 to 2 mL/min at pressures of 50 to 400 bar. Ultra-high-performance systems with particles below 2 µm work at up to about 1,000 bar for faster separations.
The parts of an HPLC system
Pumps deliver the mobile phase at a steady, pulse-free flow. An isocratic method uses a constant mobile phase composition; a gradient method changes it during the run, for example increasing the fraction of organic solvent, much as temperature programming does in GC. The mobile phase is filtered and degassed, because bubbles cause noisy baselines and particles damage pumps and columns. An autosampler injects a precise volume, typically 5 to 20 µL, through a sample loop. A guard column, a short cartridge of the same packing, protects the expensive analytical column from particles and strongly retained material. Columns are often held in a temperature-controlled compartment, because retention depends on temperature.
| Detector | Principle | Typical use |
|---|---|---|
| UV-visible absorbance | Absorbance at one or many wavelengths (diode array) | Compounds with chromophores: aromatics, many drugs and pesticides |
| Refractive index (RI) | Change in refractive index of the eluent | Sugars, alcohols, glycerol: compounds with no chromophore |
| Fluorescence | Light emitted after excitation | Very sensitive for fluorescent compounds such as aflatoxins |
| Conductivity | Electrical conductivity of the eluent | Ions in ion chromatography |
| Mass spectrometer | Ions formed from each compound, separated by mass | Identification and trace confirmation |
The refractive index detector is universal, responding to almost any dissolved compound, which suits sugars that have no useful UV absorption. It has two drawbacks: it is far less sensitive than UV or fluorescence detection, and it cannot be used with gradients, because changing the mobile phase changes the refractive index of the baseline itself.
Separation modes
Reversed-phase chromatography is the most widely used mode. The stationary phase is nonpolar, usually silica particles bonded with octadecyl (C18) chains, and the mobile phase is polar, a mixture of water with methanol or acetonitrile. Nonpolar compounds are retained longest, and adding more organic solvent to the mobile phase makes everything elute faster. Normal-phase chromatography reverses the polarities, using polar silica and nonpolar solvents. Ion-exchange chromatography uses charged stationary phases to separate ions. Size-exclusion chromatography separates molecules by size as they diffuse into and out of pores, and it is used for polymers and proteins.
Fermentation analysis uses a related mode, ion-exclusion chromatography, on a column packed with a sulfonated polystyrene resin in its hydrogen form. Strong acids and their salts are excluded from the resin's pores and elute first; weak acids, sugars and alcohols penetrate the pores to different extents and elute later. With a dilute sulfuric acid mobile phase at around 60 °C and a refractive index detector, a single isocratic run of about 20 minutes separates the longer sugars, maltose, glucose, lactic acid, glycerol, acetic acid and ethanol. This is the standard method throughout the fuel ethanol industry.
Column efficiency and the van Deemter equation
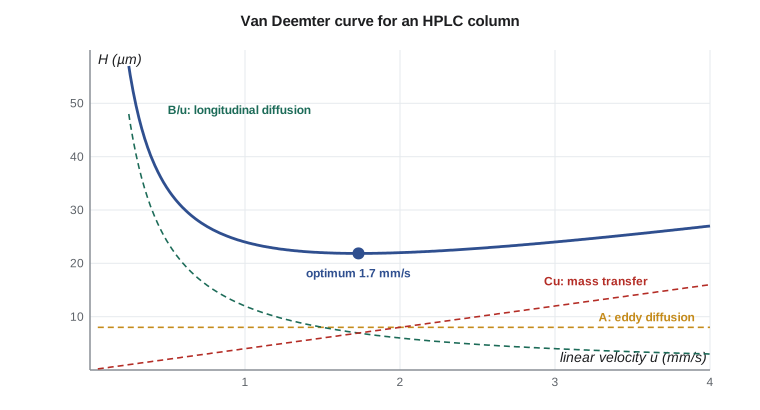
Why do small particles give better separations? The answer lies in the processes that broaden a band as it travels through a column. The van Deemter equation relates the plate height H to the linear velocity u of the mobile phase:
The A term, eddy diffusion, comes from the many paths of different length that molecules take around packing particles; it is proportional to particle size and does not depend on flow. The B term, longitudinal diffusion, is the spreading of the band by ordinary diffusion along the column; it matters most at low flow, when the band spends a long time in the column. The C term, resistance to mass transfer, arises because molecules take time to move into and out of the stationary phase, so at high flow some are carried ahead while others lag; it grows with flow and with particle size.
Setting the derivative of H to zero gives the optimum velocity and the minimum plate height:
Smaller particles reduce both A and C, so they give lower plate heights and a flatter curve at high flow, allowing faster separations without losing efficiency. The price is higher back-pressure, which rises roughly with the inverse square of particle size. The same equation applies in GC, where open capillary columns have no packing and therefore almost no A term, one reason capillary columns give so many plates.
Worked problem
Optimum flow for a column
For a 300 mm column of 5 µm particles, the van Deemter constants are A = 8.0 µm, B = 12.0 µm·mm/s and C = 4.0 µm·s/mm. Find the optimum linear velocity, the minimum plate height and the number of plates at the optimum.
Show solution
- Optimum velocity: \(u_{opt} = \sqrt{12.0/4.0} = 1.73\) mm/s.
- Minimum plate height: \(H_{min} = 8.0 + 2\sqrt{12.0 \times 4.0} = 8.0 + 13.9 = 21.9\) µm.
- Plates: \(N = L/H = 300{,}000\ \mu\text{m}/21.9\ \mu\text{m} = 13{,}700\).
Answer: The column gives about 13,700 plates at 1.73 mm/s. Running at 3 mm/s cuts analysis time by 42 percent while losing only about 9 percent of the plates, because the curve is flat above the optimum, a trade-off the lab often accepts for routine samples.
The program below evaluates the van Deemter equation for the fermentation column and quantifies glucose in a diluted beer sample from an external calibration.
# HPLC: van Deemter optimum flow and quantitation of sugars in fermenter beer
import math
# van Deemter constants for a 5 um column (H in um, u in mm/s), approximate
A, B, C = 8.0, 12.0, 4.0
u_opt = math.sqrt(B / C)
H_min = A + 2 * math.sqrt(B * C)
print(f"optimum linear velocity = {u_opt:.2f} mm/s, minimum plate height = {H_min:.1f} um")
L = 300_000  # column length, um (300 mm)
for u in (0.5, u_opt, 3.0):
    H = A + B / u + C * u
    print(f"u = {u:.2f} mm/s  H = {H:5.1f} um  N = {L / H:,.0f}")

# External calibration for glucose (refractive index detector), peak area vs g/L
cal = [(0.5, 10350), (1.0, 20810), (2.0, 41520), (5.0, 103900)]
n = len(cal); xm = sum(c for c, _ in cal) / n; ym = sum(a for _, a in cal) / n
b = sum((c - xm) * (a - ym) for c, a in cal) / sum((c - xm) ** 2 for c, _ in cal)
a0 = ym - b * xm
beer_area, dilution = 29870, 10      # filtered beer diluted 1 to 10
glucose = (beer_area - a0) / b * dilution
print(f"glucose in beer = {glucose:.1f} g/L")optimum linear velocity = 1.73 mm/s, minimum plate height = 21.9 um u = 0.50 mm/s H = 34.0 um N = 8,824 u = 1.73 mm/s H = 21.9 um N = 13,726 u = 3.00 mm/s H = 24.0 um N = 12,500 glucose in beer = 14.4 g/L
A mid-fermentation sample with 14.4 g/L glucose is normal; by the end of fermentation glucose should fall below about 1 g/L. If lactic acid rises above a few grams per liter at the same time, the fermentation team suspects a bacterial infection and may treat the fermenter.
Worked problem
What a bacterial infection costs
HPLC results for fermenter 4 show lactic acid rising from 1.2 g/L at 20 hours to 5.8 g/L at 40 hours, while a healthy fermenter stays below 2 g/L. Lactic acid bacteria convert glucose to lactic acid almost one-for-one by mass (one glucose gives two lactic acids, 180 g to 180 g). The fermenter holds 2.5 million liters of beer. How much ethanol has the infection cost, if yeast would have made about 0.48 g of ethanol from each gram of glucose?
Show solution
- Extra lactic acid formed: \(5.8 - 1.2 = 4.6\) g/L.
- Glucose diverted: about 4.6 g/L, or \(4.6 \times 2.5 \times 10^6 = 1.15 \times 10^7\) g, which is 11.5 metric tons.
- Ethanol lost: \(0.48 \times 11.5 = 5.5\) metric tons, or about \(5.5 \times 10^6\ \text{g}/0.789\ \text{g/mL} = 7.0 \times 10^6\) mL, roughly 7,000 L.
Answer: The infection has already cost about 7,000 L of ethanol in one fermenter, and the loss grows as long as the bacteria keep working. Lactic acid also stresses the yeast, so the real cost is usually higher. Fast, reliable HPLC results are what let the fermentation team catch infections at 20 hours rather than at drop.
Because each fermenter sample takes about 20 minutes on the column, a busy lab may run several HPLC systems in parallel and schedule samples so that fermenters at critical stages are tested first. Results flow automatically from the data system to the plant's process historian, where operators see sugar and acid trends beside temperatures and flows.
Ion chromatography
Ion chromatography (IC) is ion-exchange chromatography with conductivity detection, designed for small inorganic and organic ions. Anions such as chloride, nitrate and sulfate are separated on a column with positively charged functional groups, using a hydroxide or carbonate eluent. The eluent itself conducts electricity strongly, which would swamp the signal from the analytes, so a suppressor placed after the column exchanges the eluent's sodium or potassium ions for hydrogen ions, converting hydroxide eluent to water and the analyte salts to their highly conducting acids. The result is a low, stable background and detection limits in the microgram-per-liter range.
Fuel ethanol specifications limit inorganic chloride to a few milligrams per liter and sulfate to a few milligrams per kilogram, because both promote corrosion and deposits in engines. Standard methods measure them by ion chromatography, usually after diluting the ethanol with water or by injecting it directly onto a column that tolerates the solvent. The same instrument measures chloride, nitrate, sulfate and phosphate in process water and effluent, and cations such as sodium, potassium, ammonium, calcium and magnesium on a separate cation column.
Mycotoxins and other trace contaminants
Molds growing on corn in the field or in storage can produce mycotoxins, such as aflatoxins, deoxynivalenol (vomitoxin), fumonisins and zearalenone, that harm livestock. Fermentation does not destroy them, and because about two-thirds of the corn's mass is converted to ethanol and carbon dioxide, mycotoxins end up about three times more concentrated in the distillers grains than in the corn. Feed regulators, the US Food and Drug Administration among them, set limits or guidance levels for mycotoxins in feed that depend on the animal species.
At the receiving pit, the plant screens each truck with rapid test strips or kits based on antibodies, which give a result in minutes. Trucks that test high are rejected or segregated. The lab confirms screening results and tests distillers grains by HPLC with fluorescence detection for aflatoxins, or by LC-MS for multiple mycotoxins at once. These methods need careful sample cleanup, often with immunoaffinity columns that bind only the target toxin, and very careful sampling, because mycotoxins occur in hot spots: a few contaminated kernels in a truckload can carry most of the toxin, exactly the sampling problem described in Lesson 2.
Common mistakes
MistakeRunning a gradient with a refractive index detector.
InsteadRI detectors need isocratic elution; use a UV, evaporative or mass detector for gradients.
MistakeInjecting unfiltered fermenter beer.
InsteadFilter through a 0.45 µm or 0.2 µm filter and dilute, or yeast and solids will block the column.
MistakeRaising flow far above the optimum and expecting the same separation.
InsteadCheck resolution of critical pairs; plate height rises with flow above the optimum.
MistakeTreating a negative mycotoxin screen of one scoop as proof a truck is clean.
InsteadMycotoxins occur in hot spots; follow the sampling plan for the screening method.
Summary and key terms
- Liquid chromatography separates nonvolatile and heat-sensitive compounds that GC cannot handle.
- An HPLC system has pumps, an autosampler, a guard and analytical column, a column oven and a detector.
- Reversed-phase C18 columns are the most common; ion-exclusion columns with RI detection measure sugars, acids and ethanol in fermentation.
- The van Deemter equation H = A + B/u + Cu explains band broadening; smaller particles give more plates at higher flow.
- Ion chromatography with suppressed conductivity measures chloride and sulfate in fuel ethanol and water.
- Mycotoxins concentrate about threefold in distillers grains and are screened rapidly, then confirmed by HPLC or LC-MS.
- HPLC
- High-performance liquid chromatography, using small particles and high pressure for efficient separations.
- Reversed-phase chromatography
- LC with a nonpolar stationary phase and a polar mobile phase.
- Ion-exclusion chromatography
- Separation on a charged resin in which ionized species are excluded from the pores and neutral species penetrate them.
- Gradient elution
- Changing the mobile phase composition during a run to elute compounds with a wide range of retention.
- Refractive index detector
- A universal LC detector that responds to changes in the refractive index of the eluent.
- Van Deemter equation
- An equation relating plate height to mobile phase velocity through eddy diffusion, longitudinal diffusion and mass transfer terms.
- Suppressor
- A device in ion chromatography that lowers the conductivity of the eluent while raising that of the analytes.
- Mycotoxin
- A toxic compound produced by molds that can contaminate grain and feed.
Practice problems
Work each problem on paper first, then reveal the answer to check.
Why can't glucose be measured by gas chromatography without derivatization?
Show answer
It is nonvolatile and decomposes before it vaporizes.
In reversed-phase HPLC, what happens to retention when the percentage of acetonitrile is increased?
Show answer
Retention decreases; compounds elute faster.
For A = 5 µm, B = 9 µm·mm/s and C = 1 µm·s/mm, find the optimum velocity and minimum plate height.
Show answer
\(u_{opt} = 3\) mm/s; \(H_{min} = 5 + 2\sqrt{9} = 11\) µm.
Why does a suppressor improve detection in ion chromatography?
Show answer
It converts the conducting eluent to water and the analytes to more conducting acids, lowering background and raising signal.
Corn contains 4 ppm deoxynivalenol. Roughly what level might appear in the distillers grains?
Show answer
About three times higher, around 12 ppm.
Why is a guard column used?
Show answer
To trap particles and strongly retained material that would damage the analytical column.
Lesson quiz · 5 questions
Score 60% or more to complete this lesson.
Create a free account to save your progress, take quizzes and earn a certificate.