
CHE-250 · Lesson 10 of 12 · 23 min
Temperature and reaction rates
Every operator at Kingfisher Bioenergy knows that temperature runs the plant. The jet cooker heats the mash to about 105 °C so that the liquefaction enzymes work fast; the fermenters are cooled to stay near 32 °C because a few degrees warmer slows and then kills the yeast; and the dehydration catalyst in the proposed ethylene unit would need 300 °C or more to react at a useful rate. Lesson 9 described rates at a fixed temperature. This lesson explains why rate constants depend so strongly on temperature, often doubling for a 10 K rise, and how two molecular theories, collision theory and transition-state theory, account for it.
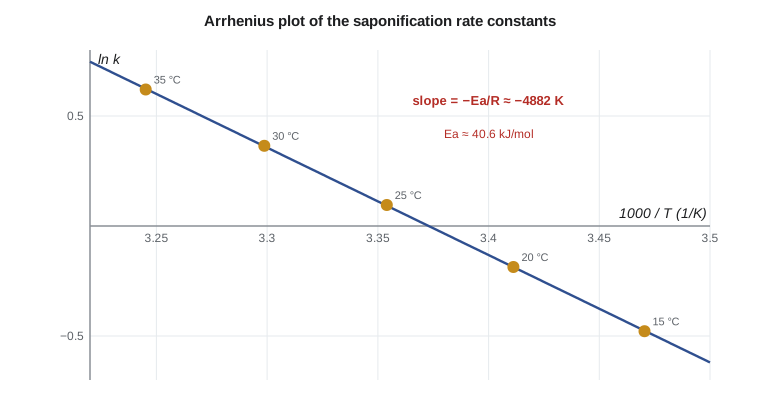
Theo's data for this lesson come from the same saponification experiment, repeated by the lab technician at five temperatures between 15 and 35 °C. Ingrid wants him to extract the activation energy, predict the rate constant at a temperature the lab did not test and then use the same reasoning to explain why the enzyme deactivation of Lesson 9 is so sensitive to the cooker temperature.
The Arrhenius equation
In 1889 Svante Arrhenius proposed that rate constants vary with temperature as:
The activation energy \(E_a\) is the minimum energy that reacting molecules must have, and \(A\), the pre-exponential factor, has the units of \(k\) and reflects how often molecules meet in a suitable way. A plot of \(\ln k\) against \(1/T\), an Arrhenius plot, is a straight line with slope \(-E_a/R\), the same form as the van 't Hoff and Clausius-Clapeyron plots of Lessons 4 and 5. Activation energies of common reactions lie between about 40 and 200 kJ/mol. Taking the ratio of the equation at two temperatures eliminates \(A\):
The familiar rule of thumb that rates double for every 10 K near room temperature corresponds to an activation energy of about 53 kJ/mol between 25 and 35 °C. Reactions with larger activation energies are more sensitive to temperature, and that has important consequences for selectivity, because raising the temperature speeds up high-activation-energy reactions more than low ones.
Worked problem
Activation energy from two rate constants
The saponification rate constant is 1.10 L/(mol min) at 25 °C and 1.86 L/(mol min) at 35 °C. Find the activation energy and predict \(k\) at 50 °C.
Show solution
- \(\ln(1.86/1.10) = 0.525\); \(1/308.15 - 1/298.15 = -1.088 \times 10^{-4}\) K⁻¹.
- \(E_a = -R \times 0.525/(-1.088 \times 10^{-4}) = 8.314 \times 4826 = 40.1\) kJ/mol.
- At 50 °C: \(\ln(k/1.10) = -(40{,}100/8.314)(1/323.15 - 1/298.15) = 1.252\), so \(k = 1.10 \times 3.50 = 3.85\) L/(mol min).
Answer: About 40 kJ/mol, and a predicted rate constant near 3.9 L/(mol min) at 50 °C, three and a half times the value at 25 °C. A least-squares fit to all five temperatures, in the program below, gives 40.6 kJ/mol.
Collision theory
Why should rates follow the Arrhenius form? Collision theory gives the simplest answer for gas-phase reactions, building on the kinetic theory of Lesson 1. Two molecules can react only if they collide, so the rate cannot exceed the collision rate. Not every collision works, though. Only those with enough energy along the line of centers, at least \(E_a\), can break the bonds that must break, and the fraction of collisions with that much energy is approximately \(\exp(-E_a/RT)\), the high-energy tail of the Maxwell-Boltzmann distribution. Finally, the molecules must collide in the right orientation, which collision theory captures with a steric factor \(p\) less than one. The rate constant becomes:
where \(\sigma\) is the collision cross-section and \(\mu\) the reduced mass of the two molecules. Everything in front of the exponential corresponds to the Arrhenius \(A\). For typical small molecules at 600 K the collision factor is around \(10^{11}\) L/(mol s), an upper limit on any bimolecular rate constant in the gas phase.
The exponential factor is what makes temperature so powerful. For an activation energy of 100 kJ/mol, only about three collisions in \(10^{18}\) have enough energy at 25 °C, but that fraction nearly quadruples by 35 °C. The collision rate itself rises by less than 2 percent over the same range. Temperature speeds up reactions not because molecules meet more often but because a much larger share of their meetings carries enough energy.
The steric factor shows the limits of the theory. For simple reactions of atoms it is close to 1. For reactions of larger molecules, measured rate constants are often a thousand or a million times smaller than the collision factor, because only a small range of orientations lets the reacting atoms meet. Collision theory has no way to predict \(p\); a better theory is needed.
Transition-state theory
Transition-state theory, developed by Henry Eyring and others in the 1930s, pictures a reaction as passing over an energy barrier along a reaction coordinate, a path through all the atomic positions that leads from reactants to products. At the top of the barrier sits the activated complex, or transition state, a fleeting arrangement in which old bonds are partly broken and new ones partly formed. The theory assumes that the activated complex is in quasi-equilibrium with the reactants and that it falls apart into products at a universal frequency \(k_BT/h\), about \(6 \times 10^{12}\) s⁻¹ at room temperature. This leads to the Eyring equation:
where \(h\) is Planck's constant and \(\Delta^{\ddagger}H\) and \(\Delta^{\ddagger}S\) are the enthalpy and entropy of activation, the changes in going from reactants to the activated complex. For reactions in solution, \(E_a \approx \Delta^{\ddagger}H + RT\). The entropy of activation replaces the mysterious steric factor with a thermodynamic quantity: a large negative \(\Delta^{\ddagger}S\) means the activated complex is much more ordered than the reactants, as when two molecules must come together in a precise orientation, and the reaction is correspondingly slower.
A plot of \(\ln(k/T)\) against \(1/T\), an Eyring plot, gives \(\Delta^{\ddagger}H\) from the slope and \(\Delta^{\ddagger}S\) from the intercept. For the saponification data, the program below finds \(\Delta^{\ddagger}H \approx 38\) kJ/mol and \(\Delta^{\ddagger}S \approx -150\) J/(mol K). The large negative entropy of activation fits the mechanism you met in CHE-243: a hydroxide ion and an ester molecule must combine into a single tetrahedral intermediate, losing the freedom of two independent particles, and surrounding water molecules must organize around the developing charge.
When Arrhenius plots curve
Not every set of rate constants falls on a straight Arrhenius line, and the shape of the departure is informative. Enzyme-catalyzed reactions are the clearest example. Their rate rises with temperature at first, as the Arrhenius equation predicts, then passes through a maximum and falls steeply, because above a certain temperature the enzyme unfolds faster than it works. Plotting the measured activity of a liquefaction enzyme against temperature gives that familiar optimum curve; the optimum quoted on an enzyme data sheet is not a fixed property but depends on how long the enzyme is held at temperature, since deactivation is a time-dependent first-order process.
A curved Arrhenius plot can also signal a change of mechanism, with one pathway dominating at low temperature and another at high temperature, or a reaction made of several steps whose relative importance shifts as the temperature changes. Solid catalysts often show a sharp bend when the chemical reaction becomes so fast that the rate is limited instead by diffusion of reactants into the catalyst pores. Diffusion has an apparent activation energy of only 10 to 20 kJ/mol, so above the bend the plot flattens. Chemical engineers watch for that change because it means making the catalyst more active will no longer help; making its particles smaller will.
In solution, the fastest possible reactions are limited by how quickly the reactants can diffuse together through the solvent. These diffusion-controlled reactions, such as the neutralization of hydrogen ions by hydroxide ions, have rate constants around \(10^{10}\) L/(mol s) in water and apparent activation energies close to that of the solvent's viscosity, about 15 to 20 kJ/mol. Every collision between the reactants leads to reaction, so the rate is set by transport, not by a chemical barrier. Comparing a measured rate constant with the diffusion limit is a quick test of whether a reaction in solution has any significant chemical barrier at all.
Temperature, selectivity and safety
Because rate constants with larger activation energies rise faster with temperature, temperature is a powerful lever on selectivity when two reactions compete. In ethanol dehydration, the reaction that forms diethyl ether has a lower activation energy than the reaction that forms ethylene, so low temperatures favor ether and high temperatures favor ethylene, which is one reason the process runs hot. In the liquefaction tank, the useful starch hydrolysis has a modest activation energy, while the unfolding of the enzyme protein that destroys its activity has a very large one, often 200 kJ/mol or more. A few degrees too hot therefore barely speeds up liquefaction but sharply accelerates enzyme deactivation, and the operator's setpoint is a compromise between the two.
The same sensitivity is why runaway reactions are dangerous, a topic CHE-243 introduced. An exothermic reaction releases heat at a rate that rises exponentially with temperature, while a cooling system removes heat at a rate that rises only linearly. Above a certain temperature, heat generation outruns cooling, the temperature climbs, the rate climbs faster, and the reaction runs away. Process safety studies use the Arrhenius equation to find that critical temperature and to set alarm and trip points well below it.
Calculating activation parameters
The program below fits the five rate constants to the Arrhenius equation by least squares, predicts rate constants at other temperatures, performs the Eyring analysis, shows how the fraction of energetic collisions changes between 25 and 35 °C for two activation energies, and estimates the collision-theory frequency factor for a gas-phase reaction.
# Arrhenius and Eyring analysis of rate constants measured at several temperatures
import math
R, kB, h = 8.314, 1.380649e-23, 6.62607e-34

def fit(x, y):
    n = len(x); mx = sum(x) / n; my = sum(y) / n
    m = sum((a - mx) * (b - my) for a, b in zip(x, y)) / sum((a - mx) ** 2 for a in x)
    return m, my - m * mx

# illustrative second-order rate constants, L/(mol min), for the saponification of Lesson 9
data = [(15, 0.62), (20, 0.83), (25, 1.10), (30, 1.44), (35, 1.86)]
T = [t + 273.15 for t, k in data]
k = [kk for t, kk in data]
slope, icpt = fit([1 / x for x in T], [math.log(v) for v in k])
Ea = -slope * R; A = math.exp(icpt)
print(f"Arrhenius: Ea = {Ea / 1000:.1f} kJ/mol, A = {A:.3g} L/(mol min)")
for t in (10, 40, 50):
    print(f"  predicted k at {t} C = {A * math.exp(-Ea / (R * (t + 273.15))):.2f} L/(mol min)")
print(f"  ratio k(35 C)/k(25 C) = {k[4] / k[2]:.2f}")

# Eyring: ln(k/T) against 1/T; k converted to L/(mol s)
ks = [v / 60 for v in k]
s2, i2 = fit([1 / x for x in T], [math.log(v / x) for v, x in zip(ks, T)])
dH = -s2 * R
dS = R * (i2 - math.log(kB / h))
print(f"Eyring: dH(act) = {dH / 1000:.1f} kJ/mol, dS(act) = {dS:.0f} J/(mol K)")

# fraction of collisions with enough energy, exp(-Ea/RT), and its sensitivity to temperature
for Ea_kJ in (50, 100):
    f1 = math.exp(-Ea_kJ * 1000 / (R * 298.15)); f2 = math.exp(-Ea_kJ * 1000 / (R * 308.15))
    print(f"Ea = {Ea_kJ} kJ/mol: fraction at 25 C = {f1:.2e}, at 35 C = {f2:.2e}, ratio = {f2 / f1:.1f}")

# collision theory upper limit for a gas-phase bimolecular reaction at 600 K (illustrative molecules)
d, M1, M2, Tg = 4.0e-10, 0.028, 0.044, 600.0
mu = M1 * M2 / (M1 + M2) / 6.02214e23
vrel = math.sqrt(8 * kB * Tg / (math.pi * mu))
Z = math.pi * d ** 2 * vrel * 6.02214e23 * 1000          # L/(mol s)
print(f"\ncollision frequency factor at 600 K = {Z:.2e} L/(mol s)")Arrhenius: Ea = 40.6 kJ/mol, A = 1.42e+07 L/(mol min) predicted k at 10 C = 0.46 L/(mol min) predicted k at 40 C = 2.40 L/(mol min) predicted k at 50 C = 3.89 L/(mol min) ratio k(35 C)/k(25 C) = 1.69 Eyring: dH(act) = 38.1 kJ/mol, dS(act) = -150 J/(mol K) Ea = 50 kJ/mol: fraction at 25 C = 1.74e-09, at 35 C = 3.34e-09, ratio = 1.9 Ea = 100 kJ/mol: fraction at 25 C = 3.02e-18, at 35 C = 1.12e-17, ratio = 3.7 collision frequency factor at 600 K = 2.61e+11 L/(mol s)
Between 25 and 35 °C, the fraction of collisions exceeding 50 kJ/mol roughly doubles, while for 100 kJ/mol it nearly quadruples. That simple comparison explains why reactions with high activation energies, such as protein unfolding and many decompositions, are so sensitive to temperature excursions.
Common mistakes
MistakeUsing Celsius in the Arrhenius equation.
InsteadAlways use kelvins; 1/T must be absolute.
MistakeThinking higher temperature speeds reactions mainly by increasing collisions.
InsteadThe collision rate rises slowly; the fraction of energetic collisions rises exponentially.
MistakeAssuming a catalyst changes the overall ΔH.
InsteadA catalyst lowers Ea by providing another path; ΔH between reactants and products is unchanged.
MistakeApplying the 'doubles every 10 K' rule everywhere.
InsteadIt holds only for Ea near 50 kJ/mol near room temperature; check Ea before relying on it.
Summary and key terms
- Arrhenius: k = A exp(−Ea/RT); ln k is linear in 1/T with slope −Ea/R.
- Rates roughly double per 10 K near room temperature when Ea ≈ 50 kJ/mol; larger Ea means greater sensitivity.
- Collision theory: rate = collision rate × fraction with energy ≥ Ea × steric factor.
- Transition-state theory: k = (k_BT/h) exp(Δ‡S/R) exp(−Δ‡H/RT); Eyring plots give the activation parameters.
- Competing reactions with different activation energies respond differently to temperature, which controls selectivity.
- Exponential temperature dependence underlies runaway reactions and enzyme deactivation.
- Activation energy
- The minimum energy reacting molecules need, Ea in the Arrhenius equation.
- Pre-exponential factor
- The factor A in the Arrhenius equation, related to the frequency and orientation of collisions.
- Arrhenius plot
- A plot of ln k against 1/T, with slope −Ea/R.
- Steric factor
- The fraction of energetic collisions with an orientation suitable for reaction.
- Transition state
- The highest-energy arrangement of atoms along the reaction path, also called the activated complex.
- Reaction coordinate
- The path through atomic positions leading from reactants to products.
- Eyring equation
- The transition-state theory expression for a rate constant in terms of activation enthalpy and entropy.
- Entropy of activation
- The entropy change from reactants to the activated complex; negative values mean an ordered transition state.
Practice problems
Work each problem on paper first, then reveal the answer to check.
A reaction's rate constant triples between 300 K and 320 K. What is Ea?
Show answer
\(E_a = R\ln 3/(1/300 - 1/320) = 8.314 \times 1.099/2.083 \times 10^{-4} = 43.8\) kJ/mol.
With Ea = 80 kJ/mol, by what factor does k increase from 25 °C to 35 °C?
Show answer
\(\exp[(80{,}000/8.314)(1/298.15 - 1/308.15)] = e^{1.047} = 2.85\).
What does a large negative entropy of activation suggest about the transition state?
Show answer
It is much more ordered than the reactants, for example two molecules joined in a specific orientation.
Why does a catalyst not change the equilibrium constant?
Show answer
It lowers the barrier for both directions equally, so k_f/k_r is unchanged.
Two reactions compete, with Ea of 60 and 120 kJ/mol. Which is favored by raising the temperature?
Show answer
The one with 120 kJ/mol, because its rate constant rises faster.
Roughly what is k_BT/h at 298 K?
Show answer
\(1.381 \times 10^{-23} \times 298/6.626 \times 10^{-34} = 6.2 \times 10^{12}\) s⁻¹.
Lesson quiz · 5 questions
Score 60% or more to complete this lesson.
Create a free account to save your progress, take quizzes and earn a certificate.