
PMP-130 · Lesson 6 of 12 · 26 min
Estimating durations and resources
With activities defined and sequenced, the next step is to estimate what each one needs: which resources, how much effort, and how long it will take. Estimates are predictions, not promises, and their quality largely determines the quality of the schedule and budget built on them. This lesson covers resource estimating and the resource breakdown structure, the difference between effort and duration, the main estimating techniques (analogous, parametric, bottom-up and three-point), how to express uncertainty with ranges, common estimating biases, and estimating in adaptive projects. Cost estimating uses the same techniques and is covered in lesson 9.
Estimating resources
Resources include people, equipment, materials, facilities and services. For each activity, the team estimates the type and quantity of resources needed. The results feed both the duration estimate (more or fewer people change how long work takes) and the cost estimate. Resource estimates also reveal constraints early: if the plan needs four electricians in the same week but the contractor can supply only four in total, that conflict must be managed.
A resource breakdown structure (RBS) is a hierarchical list of resources by category and type, such as labour (internal staff, contractors), equipment, materials and supplies. It helps organize resource estimates and costs and can be used alongside the WBS to show which resources are needed for which deliverables. Resource calendars show when each resource is available, including holidays, other project commitments and shift patterns.
| Category | Type | Project Compass examples |
|---|---|---|
| People: internal | Library staff | Branch manager, collections technicians, IT analyst, trainer |
| People: external | Contractors and consultants | Architect, general contractor's trades, app developers, temporary tagging staff |
| Equipment | Owned or rented | Encoding stations, scissor lift, moving trolleys |
| Materials | Consumed in the work | RFID tags, shelving, flooring, cabling |
| Services and facilities | Bought in | Moving company, storage for collection items, app store accounts |
Effort and duration
Effort is the number of labour units needed to complete an activity, such as person-hours or person-days. Duration is the total number of work periods needed, excluding non-working time. They are related but not the same. An activity needing 80 person-hours of effort might take 10 working days for one person, or 5 days for two, but adding people does not always shorten duration proportionally.
Several effects limit the benefit of adding resources. Some work cannot be divided: one person must write a specification, and splitting it creates coordination overhead. Shared equipment, workspace or access can become the bottleneck. New people need time to learn the work. Brooks's law, from software engineering, warns that adding people to a late software project often makes it later because of the training and communication burden. The law of diminishing returns says that beyond some point, each extra unit of resource adds less output.
# Parametric effort and duration for RFID tagging (activity C's in-house work)
items = 38_000
rate_per_hour = 110          # items tagged and encoded per person-hour (pilot result)
productive_hours = 6.5       # productive hours in a 7.5-hour shift
rework = 0.03                # share of items needing a second pass (pilot result)

effort_h = items * (1 + rework) / rate_per_hour
print(f"Effort: {effort_h:,.0f} person-hours")
for staff in (2, 3, 4, 6):
    days = effort_h / (staff * productive_hours)
    print(f"{staff} staff: {days:5.1f} working days")

# Diminishing returns: only two encoding stations, so extra people share them
stations = 2
for staff in (2, 3, 4, 6):
    usable = min(staff, stations * 1.5)      # a helper per station can prepare items
    days = effort_h / (usable * productive_hours)
print(f"{staff} staff on {stations} stations: {days:5.1f} working days")Effort: 356 person-hours 2 staff: 27.4 working days 3 staff: 18.2 working days 4 staff: 13.7 working days 6 staff: 9.1 working days 2 staff on 2 stations: 27.4 working days 3 staff on 2 stations: 18.2 working days 4 staff on 2 stations: 18.2 working days 6 staff on 2 stations: 18.2 working days
The pilot tagging run showed that one person tags and encodes about 110 items an hour, with 3 % needing a second pass. That gives 356 person-hours of effort. With unlimited stations, four people would finish in about 14 working days. But the library has only two encoding stations. Up to three people can work productively (two at stations and one preparing items), so adding a fourth or sixth person does not shorten the work below about 18 days. The constraint is the equipment, not the people, and the cheaper fix may be renting a third station.
Estimating techniques
Four techniques appear constantly on the exam. Each trades accuracy against the time and information it needs.
| Technique | How it works | When to use | Accuracy and effort |
|---|---|---|---|
| Analogous (top-down) | Uses the actual duration or cost of a similar previous activity or project, adjusted for differences | Early, with limited detail; when a truly similar past project exists | Quick and cheap; less accurate |
| Parametric | Uses a statistical relationship between historical data and variables (rate × quantity) | When work is repetitive and reliable unit rates exist | Can be accurate if the model and data are good |
| Bottom-up | Estimates each work package or activity in detail, then aggregates | When the scope is well defined | Most accurate; most time-consuming |
| Three-point | Uses optimistic, most likely and pessimistic estimates to reflect uncertainty | When activities are uncertain | Produces an expected value and a measure of spread |
Analogous estimating relies heavily on expert judgement about how the old and new situations differ. Parametric estimating is only as good as its parameters: tagging rates from a pilot at the actual branch are more reliable than a vendor's brochure figure. Bottom-up estimates are built by the people closest to the work and are typically used when the plan is baselined. Many organizations use analogous or parametric estimates early, then replace them with bottom-up estimates as detail emerges, which is progressive elaboration applied to estimates.
Other inputs improve estimates. Expert judgement from people who have done the work before. Historical data in organizational process assets. Vendor bid analysis for contracted work. Decision-making techniques such as voting or the Delphi technique, where experts estimate anonymously, see each other's results and revise until estimates converge, reducing the influence of a dominant voice.
Three-point estimates
Three-point estimating addresses uncertainty directly. For each activity, the team estimates an optimistic duration (O), a most likely duration (M) and a pessimistic duration (P). Two formulas are common. The triangular distribution gives an expected duration of \(\frac{O + M + P}{3}\). The beta distribution, used in the program evaluation and review technique (PERT), weights the most likely value more heavily:
Here \(\sigma\) is an approximate standard deviation, a measure of uncertainty. A wider gap between optimistic and pessimistic means more uncertainty. For a path of activities, the expected durations add, and, assuming the activities are independent, the variances (\(\sigma^2\)) add, so the path standard deviation is the square root of the sum of variances. On the exam, read carefully whether a question wants the triangular or the beta (PERT) value; if it says only "three-point" without a formula, the beta version is usually intended, but check the options.
# Three-point estimates for the Project Compass critical activities (working days)
import math
est = {  # activity: (optimistic, most likely, pessimistic)
    "A Design fit-out": (12, 15, 21),
    "B Building permit": (15, 20, 35),
    "D Demolition": (8, 10, 14),
    "F HVAC upgrade": (16, 20, 30),
    "G Finishes": (12, 15, 21),
    "H Install shelving": (8, 10, 13),
    "J Collection move": (6, 8, 11),
    "K Soft opening": (2, 2, 2),
}
print(f"{'Activity':20s} {'Tri':>6s} {'PERT':>6s} {'SD':>5s}")
tot_e = tot_var = 0.0
for name, (o, m, p) in est.items():
    tri = (o + m + p) / 3
    pert = (o + 4 * m + p) / 6
    sd = (p - o) / 6
    tot_e += pert; tot_var += sd ** 2
    print(f"{name:20s} {tri:6.1f} {pert:6.1f} {sd:5.2f}")
path_sd = math.sqrt(tot_var)
print(f"\nPath expected duration: {tot_e:.1f} days, SD {path_sd:.2f} days")
for z, pct in [(1, 84.1), (2, 97.7)]:
    print(f"About {pct}% chance of finishing within {tot_e + z * path_sd:.1f} days")
print(f"Sum of most likely values: {sum(m for _, m, _ in est.values())} days")Activity Tri PERT SD A Design fit-out 16.0 15.5 1.50 B Building permit 23.3 21.7 3.33 D Demolition 10.7 10.3 1.00 F HVAC upgrade 22.0 21.0 2.33 G Finishes 16.0 15.5 1.50 H Install shelving 10.3 10.2 0.83 J Collection move 8.3 8.2 0.83 K Soft opening 2.0 2.0 0.00 Path expected duration: 104.3 days, SD 4.84 days About 84.1% chance of finishing within 109.2 days About 97.7% chance of finishing within 114.0 days Sum of most likely values: 100 days
Pessimistic estimates are often much further from the most likely value than optimistic ones, because things can go badly wrong in more ways than they can go unusually well. So the expected duration is usually longer than the most likely duration. Here the critical path's most likely durations sum to 100 days, but the PERT expected duration is 104.3 days with a standard deviation of 4.84 days. Using the normal approximation, there is roughly an 84 % chance of finishing within one standard deviation above the mean (about 109 days) and roughly 98 % within two (about 114 days).
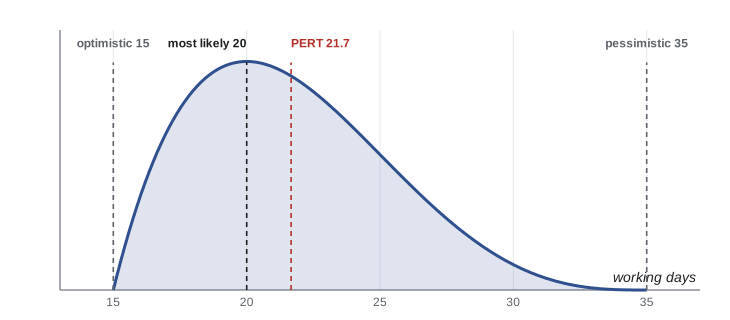
These probability statements depend on assumptions: that the estimates are honest, that activities are independent and that only this path matters. Lesson 8 shows with simulation that merging paths make the real probability lower. Three-point estimates are still much better than single numbers, because they make uncertainty visible and start a conversation about it.
Estimating biases and behaviours
Human factors distort estimates. Optimism bias leads people to underestimate durations, especially for familiar work. Anchoring ties estimates to the first number mentioned, such as a sponsor's hoped-for date. Padding inflates estimates to protect against uncertainty, and when every activity is padded the schedule becomes long while each person still feels at risk. Parkinson's law says work expands to fill the time available, so padded time is often consumed rather than saved. Student syndrome describes delaying the start of work until the deadline is near, wasting the buffer at the beginning.
Better practice is to estimate without padding, make uncertainty explicit with ranges or three-point estimates, and hold reserves openly at the project or path level rather than hiding them in every activity. Estimates should be made by, or with, the people who will do the work, based on clear scope and documented assumptions. The basis of estimates records how each estimate was derived, its assumptions and constraints, its range and its confidence level. When an estimate is challenged, the basis of estimates lets the discussion focus on assumptions rather than on personalities.
Worked problem
Responding to pressure on an estimate
The team estimates the HVAC upgrade at 20 working days most likely, with a range of 16 to 30. The sponsor says, "Other branches did it in 12; just use 12." What should the project manager do?
Show solution
- Ask what made the other jobs shorter: smaller units, no ductwork changes, different season or contractor.
- Review the basis of estimate: this unit needs new ductwork and a roof curb, which the others did not.
- Show the three-point range and the effect of 12 days on the probability of meeting the schedule.
- If the sponsor still wants 12 days, explore what would make it feasible, such as prefabricated ductwork or a second crew, with their cost and risk.
Answer: Keep the estimate honest and evidence-based, explain the reasons and offer options. Do not simply accept an imposed number that the evidence does not support.
Estimating in adaptive projects
Adaptive teams often estimate in relative terms. Story points express the relative size of backlog items, combining effort, complexity and uncertainty, and are commonly estimated with planning poker, a consensus technique similar to Delphi. Velocity is the number of points a team completes per iteration, measured from experience rather than guessed. Dividing the remaining backlog by velocity gives a forecast number of iterations, as in lesson 3. Some teams skip points altogether and count items, using throughput from flow metrics. Ideal days or t-shirt sizes are other options. Points are a team's internal tool: comparing velocity across teams, or using it as a performance target, encourages inflation and undermines forecasting.
Timeboxing changes the estimating question. Instead of "how long will this take", the team asks "how much can we fit in the next two weeks". The duration is fixed; scope flexes. For the Project Compass app, the release date is fixed by the opening, so the product owner decides which features fit, using velocity forecasts updated every sprint.
Common mistakes
MistakeAssuming twice the people halves the duration.
InsteadCheck for indivisible work, shared equipment and coordination overhead.
MistakePadding every activity estimate.
InsteadEstimate realistically and hold reserves openly at the project or path level.
MistakeAccepting a sponsor's desired duration as the estimate.
InsteadEstimate from evidence, explain the basis and offer options to meet a target.
MistakeUsing a single-point estimate for highly uncertain work.
InsteadUse three-point estimates or ranges and communicate confidence.
MistakeComparing story point velocity between teams.
InsteadUse velocity only within a team for forecasting.
Summary and key terms
- Estimate resource types and quantities per activity; organize them with a resource breakdown structure and calendars.
- Effort is labour units; duration is working periods. Adding resources has diminishing returns.
- Analogous is quick and less accurate; parametric uses rates; bottom-up is detailed and most accurate.
- Three-point estimates: triangular (O + M + P)/3 or PERT (O + 4M + P)/6 with σ = (P − O)/6.
- Path expected durations add; variances add; path σ is the square root of summed variances.
- Beware optimism, anchoring, padding, Parkinson's law and student syndrome; document the basis of estimates.
- Adaptive teams use relative sizing, velocity or throughput, and timeboxes.
- Effort
- The number of labour units required to complete an activity.
- Duration
- The total number of work periods required to complete an activity.
- Resource breakdown structure
- A hierarchical representation of resources by category and type.
- Analogous estimating
- Estimating using values from a similar previous activity or project.
- Parametric estimating
- Estimating using an algorithm based on historical data and project parameters.
- Bottom-up estimating
- Estimating by aggregating estimates of lower-level components.
- Three-point estimating
- Estimating with optimistic, most likely and pessimistic values to reflect uncertainty.
- PERT
- Program evaluation and review technique; uses a weighted average (O + 4M + P)/6.
- Basis of estimates
- Supporting detail explaining how estimates were derived, with assumptions and ranges.
- Story points
- A relative measure of the size of backlog items used by adaptive teams.
Practice problems
Work each problem on paper first, then reveal the answer to check.
O = 6, M = 9, P = 18. PERT expected duration?
Show answer
(6 + 36 + 18) / 6 = 10.
Same values: triangular expected duration?
Show answer
(6 + 9 + 18) / 3 = 11.
Same values: PERT standard deviation?
Show answer
(18 − 6) / 6 = 2.
Two activities have σ of 3 and 4 days. What is the path σ?
Show answer
√(9 + 16) = 5 days.
An activity needs 120 person-hours; two people work 6 productive hours a day. Duration?
Show answer
120 / 12 = 10 working days.
Which technique is quickest but least accurate?
Show answer
Analogous estimating.
A team uses $650 per square metre from recent jobs. Which technique?
Show answer
Parametric estimating.
Work fills the time available. Which law?
Show answer
Parkinson's law.
Why did a fourth tagger not shorten the tagging duration?
Show answer
Only two encoding stations were available, so the equipment was the constraint.
What is the Delphi technique?
Show answer
Experts estimate anonymously and revise after seeing summarized results until estimates converge.
Lesson quiz · 5 questions
Score 60% or more to complete this lesson.
Create a free account to save your progress, take quizzes and earn a certificate.