
MSAZ-110 · Lesson 3 of 12 · 21 min
Machine learning basics: features, labels, training and inference
▶ Video coming soon A video version of this lesson is on the way.
The third AI hour, on November 16, starts with a puzzle. Arjun shows Maya a spreadsheet of 2,000 past deliveries with columns for the order date, the delivery distance, the weight of the order, the number of items, the day of the week, whether the order included a bulky item, and a final column that says whether the delivery arrived late. "Suppose a new order comes in tomorrow," he says. "Can you tell me if it will be late?" Maya studies the rows. Long distances and bulky items seem to be late more often, and so do Friday orders. She makes a guess. Arjun smiles. "You just did machine learning in your head. Now let's do it properly."
Although AI-901 focuses on generative AI, Microsoft expects candidates to understand how models learn, because the same ideas, data, training, testing and inference, apply to every model in Foundry. This lesson builds that foundation with a small, traditional example.
Features and labels
In machine learning, each example is described by features: the measurable inputs the model uses to make its prediction. In the delivery spreadsheet the features are distance, weight, item count, day of the week and whether there is a bulky item. The label is the answer the model should learn to predict, here whether the delivery was late. A model is a mathematical function that maps features to a predicted label, and training is the process of adjusting that function until its predictions match the known labels as closely as possible.
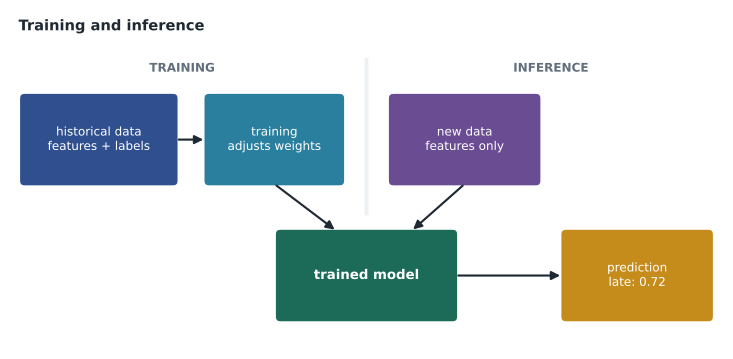
When the data includes the correct labels, the learning is called supervised learning. Most business machine learning is supervised: predicting sales from past sales, predicting churn from past customers who left, predicting late deliveries from past deliveries. When the data has no labels and the goal is to find structure, the learning is unsupervised. Clustering customers into groups with similar buying habits is the classic unsupervised task.
Regression, classification and clustering
Supervised learning splits by what kind of label it predicts. Regression predicts a number on a continuous scale: the number of patio sets a store will sell, the minutes a call will last, the price a used tool will fetch. Classification predicts a category. When there are two categories, such as late or on time, it is binary classification; when there are more, such as the six email topics the contact centre uses, it is multiclass classification. Clustering, which is unsupervised, groups examples by similarity without being told what the groups are; a person then looks at each cluster and gives it a name.
| Technique | Learns from | Predicts | Harrow & Finch example |
|---|---|---|---|
| Regression | Labelled data | A number | Weekly sales of patio heaters per store |
| Binary classification | Labelled data | One of two categories | Will this delivery be late? |
| Multiclass classification | Labelled data | One of several categories | Which of six topics is this email about? |
| Clustering | Unlabelled data | Group membership | Groups of customers with similar buying habits |
Training, validation and testing
A model that has memorized its training data is useless; what matters is how well it predicts cases it has never seen. So data scientists split their data. The training set, often around 70 rows in 100, is used to fit the model. A validation set is used while experimenting, to compare different model settings and choose the best. A test set, kept aside until the end, gives an honest estimate of how the final model will perform on new data. If the test set leaks into training, the estimate is too optimistic, and the model disappoints in production.
Two failure modes have names. Overfitting happens when a model learns the training data too closely, including its noise and quirks, so it scores brilliantly on training data and poorly on new data. Underfitting happens when the model is too simple to capture the real pattern and performs poorly everywhere. Arjun compares overfitting to an agent who memorizes the answers to last month's twenty most common questions word for word and is lost the first time a customer phrases one differently.
Inference
Once trained, a model is deployed and used to make predictions on new data. This is inference. For the delivery model, inference happens each time an order is placed: the model receives the features and returns a prediction, perhaps with a probability, such as "late, with a probability of 0.72". Inference is usually fast and cheap compared with training, and it is where most of a model's working life is spent. The same is true of the large language models used in Foundry: someone else trained them at great cost, and Harrow & Finch pays only for inference, each time it sends a prompt and receives a response.
Measuring a classifier
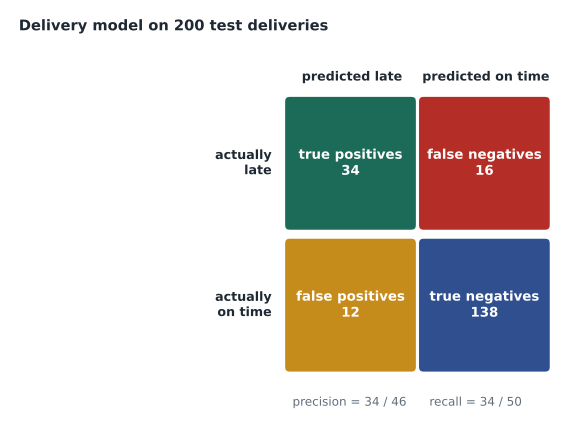
To judge the delivery model, Arjun runs it on a test set of 200 deliveries that it never saw during training, and counts four kinds of result. A true positive is a late delivery that the model predicted would be late. A false positive is an on-time delivery that the model wrongly flagged as late. A false negative is a late delivery the model missed. A true negative is an on-time delivery correctly predicted as on time. The counts are arranged in a grid called a confusion matrix.
# Confusion matrix counts for the delivery model on 200 test deliveries
tp, fn = 34, 16   # actually late: predicted late, predicted on time
fp, tn = 12, 138  # actually on time: predicted late, predicted on time
total = tp + fn + fp + tn
accuracy = (tp + tn) / total
precision = tp / (tp + fp)   # of the deliveries flagged late, how many were late
recall = tp / (tp + fn)      # of the late deliveries, how many were flagged
f1 = 2 * precision * recall / (precision + recall)
print("test deliveries:", total)
print(f"accuracy  {accuracy:.3f}")
print(f"precision {precision:.3f}")
print(f"recall    {recall:.3f}")
print(f"F1 score {f1:.3f}")test deliveries: 200 accuracy 0.860 precision 0.739 recall 0.680 F1 score 0.708
What this code does
Starts from the four counts in a confusion matrix for a model that predicts late deliveries: correctly flagged, missed, false alarms and correctly cleared. From these it calculates accuracy, precision (how many flagged deliveries were really late), recall (how many late deliveries were caught) and the F1 score that balances the two. The results show that a model can look accurate overall while still missing many late deliveries.
Accuracy, the share of all predictions that were right, is 0.86, which sounds good. But Maya notices that only 50 of the 200 deliveries were late. A lazy model that always predicted "on time" would be right 150 times in 200, an accuracy of 0.75, while catching no late deliveries at all. That is why two more measures matter. Precision asks: when the model says late, how often is it right? Here 34 of 46 flags were correct, about 0.74. Recall asks: of the deliveries that were actually late, how many did the model catch? Here 34 of 50, or 0.68. The F1 score combines precision and recall into one number, about 0.71.
Which measure matters most depends on the cost of each kind of mistake, Arjun's favourite question again. If a late prediction means the team phones the customer in advance, a false positive costs a short, unnecessary call, while a false negative leaves a customer waiting without warning. The contact centre would rather catch more late deliveries even at the cost of extra calls, so it cares more about recall. For a fraud alert that freezes a customer's account, the balance would be the opposite.
Probabilities and thresholds
Most classifiers do not simply say late or on time; they output a probability, and a threshold turns it into a decision. With a threshold of 0.5, any delivery with a predicted probability above one half is flagged late. Lowering the threshold to 0.3 flags more deliveries, which raises recall, because fewer late ones slip through, but lowers precision, because more of the flags are false alarms. Raising it does the opposite. There is no correct threshold in the abstract; the business chooses it by weighing the cost of each kind of mistake. Arjun and Maya agree to start at 0.4 for the delivery calls and review the numbers after a month.
Measuring regression
Regression models are judged by how far their predictions are from the real values. Mean absolute error is the average size of the error, in the same units as the label: if the patio heater model has a mean absolute error of 3 units, its weekly forecasts are typically off by about 3 heaters. Root mean squared error weights large errors more heavily. The coefficient of determination, R squared, describes how much of the variation in the real values the model explains, from 0 for none to 1 for all.
# Patio heater forecasts versus actual weekly sales at five stores
actual   = [12, 7, 20, 15, 9]
forecast = [10, 8, 23, 14, 9]
errors = [f - a for f, a in zip(forecast, actual)]
mae = sum(abs(e) for e in errors) / len(errors)
rmse = (sum(e * e for e in errors) / len(errors)) ** 0.5
print("errors:", errors)
print(f"mean absolute error {mae:.2f} heaters")
print(f"root mean squared error {rmse:.2f} heaters")errors: [-2, 1, 3, -1, 0] mean absolute error 1.40 heaters root mean squared error 1.73 heaters
What this code does
Compares a regression model's weekly sales forecasts with actual sales at five stores and lists each error. It then averages the size of the errors (mean absolute error) and computes the root mean squared error, which punishes large misses more. Both are given in heaters, so the numbers are easy to interpret.
Where traditional machine learning lives in Azure
Training custom models from tabular data is the job of Azure Machine Learning, a separate service for data scientists, with automated machine learning that tries many algorithms and settings and keeps the best. Harrow & Finch's data team, led by Keiko Tanabe, will use it for the stock forecasts in 2027. AI-901 itself concentrates on using ready-made generative models and Foundry Tools rather than training models, but the vocabulary of features, labels, training, validation, inference and evaluation runs through everything that follows. When Foundry evaluates a chat model's answers, it is doing the same thing Arjun did with the confusion matrix: comparing outputs with what they should have been, on cases the system has not seen before.
Data quality comes first
Before the session ends, Arjun shows Maya something odd in the delivery spreadsheet: 40 rows where the delivery date is before the order date. They come from a week when a till's clock was wrong. A model trained on them would learn nonsense. Real machine learning projects spend most of their time on data: finding errors, filling or removing missing values, making sure the labels are right, and checking that the data represents all the situations the model will face. If the training data contains only summer deliveries, the model will know nothing about snowstorms. "A model can only be as good as the examples it learns from," Arjun says, and Maya writes it under her three words from the first week.
Worked problem
Choosing the right measure
A model flags returned items that may be resold as new. On 500 test items, it flags 60, of which 45 really were resaleable; there were 75 resaleable items in total. Calculate precision and recall, and say which is more important if a wrongly flagged item would be sold to a customer as new when it is damaged.
Show solution
- Precision is true positives divided by all flagged items: 45 / 60 = 0.75.
- Recall is true positives divided by all actual positives: 45 / 75 = 0.60.
- A false positive, selling a damaged item as new, harms a customer and the brand, so precision matters more here.
Answer: Precision 0.75, recall 0.60; precision is the priority.
Common mistakes
MistakeHigh accuracy means a model is good.
InsteadOn imbalanced data a useless model can score high accuracy; check precision and recall too.
MistakeTesting on the training data shows how the model will perform.
InsteadOnly a held-back test set gives an honest estimate of performance on new data.
MistakeClustering needs labelled data.
InsteadClustering is unsupervised; it finds groups without labels.
Summary and key terms
- Features are the inputs a model uses; the label is the value it learns to predict.
- Supervised learning uses labelled data; unsupervised learning, such as clustering, finds structure without labels.
- Regression predicts numbers; classification predicts categories; clustering groups similar examples.
- Data is split into training, validation and test sets so that performance on new data can be measured honestly.
- Overfitting memorizes training data and fails on new data; underfitting is too simple to learn the pattern.
- Inference is using a trained model to make predictions on new data.
- Classifiers are judged with a confusion matrix, accuracy, precision, recall and F1; regression with errors such as MAE and RMSE.
- Feature
- A measurable input used by a model to make a prediction.
- Label
- The known answer a supervised model learns to predict.
- Training
- Adjusting a model so that its predictions fit labelled examples.
- Inference
- Using a trained model to make predictions on new data.
- Overfitting
- Learning training data so closely that the model fails on new data.
- Confusion matrix
- A table of true and false positives and negatives for a classifier.
- Precision
- Of the items predicted positive, the share that really were positive.
- Recall
- Of the items that really were positive, the share the model found.
Practice problems
Work each problem on paper first, then reveal the answer to check.
In the delivery model, what is the label?
Show answer
Whether the delivery arrived late.
What kind of task is predicting the number of minutes a call will last?
Show answer
Regression.
Why is a test set kept aside until the end?
Show answer
To give an honest estimate of performance on data the model has never seen.
What is overfitting?
Show answer
When a model learns its training data too closely and performs poorly on new data.
A model flags 46 deliveries as late and 34 were really late. What is its precision?
Show answer
34 / 46, about 0.74.
What is inference?
Show answer
Using a trained model to make predictions on new data.
Lesson quiz · 5 questions
Score 60% or more to complete this lesson.
Create a free account to save your progress, take quizzes and earn a certificate.