
MEC-440 · Lesson 12 of 12 · 21 min
Energy economics and decarbonization planning
The team has now examined every major energy conversion technology at the level of real plants. The board meets in a month to adopt a 2040 plan. Kofi's task is to turn the engineering into numbers the board can compare: the cost of heat from each pathway, the carbon it emits on the way to 2040, and the risks it carries. Elena's task is to write the recommendation. This lesson covers the economic tools that energy planners use, the policy context in each country, and the team's final comparison.
Levelized cost
Energy projects have high capital costs and long lives, while their outputs are sold year by year. The levelized cost of energy converts the capital to an equivalent annual cost using the capital recovery factor, adds the annual operating, maintenance and fuel costs, and divides by the annual output.
Here \(C_0\) is the capital cost, \(r\) the discount rate, \(N\) the life in years, \(O\&M\) the annual operation and maintenance cost, \(F\) the annual fuel or electricity cost and \(E\) the annual energy delivered. At 5 percent over 25 years the capital recovery factor is 0.071, so every million of capital costs 71,000 a year. For a heating utility the same formula gives the levelized cost of heat. When costs and output change from year to year, as they do when fuel prices rise or the grid's emissions fall, the formula is applied to present values of costs and energy, as lesson 11 did for storage.
The discount rate expresses the value of money over time and the risk of the project. Public utilities and governments often use 3 to 6 percent in real terms; private developers expect 8 to 12 percent. A higher rate favours options with low capital and high running costs, such as gas boilers, and penalizes capital-intensive options with low running costs, such as heat pumps, wind and nuclear. Every study should show how its ranking changes with the discount rate.
Externalities and carbon prices
Market prices do not include all the costs of energy. Burning fossil fuels causes climate damage, air pollution and health effects that the emitter does not pay for; economists call these externalities. A carbon price, whether a tax or a cap-and-trade system, makes emitters pay for some of the climate cost and so shifts investment toward low-carbon options. Many organizations also use an internal or shadow carbon price in their planning, applying a cost per tonne to their emissions even when no law requires it, to test whether their investments will remain sound if carbon prices rise.
In Canada, the federal government set a national benchmark for carbon pricing in 2019. The consumer fuel charge on gasoline, diesel and heating fuels was set to zero from April 1, 2025, but pricing for large industrial emitters continues under output-based systems, federal or provincial, and the government said it would review the benchmark in 2026. A utility of Northgate's size may or may not fall under industrial pricing depending on its emissions and the rules of the system that applies, so the team treats the carbon price as a planning assumption rather than a cost Northgate will certainly pay. Kofi runs the comparison at three internal carbon prices: zero, 65 and 170 per tonne, the last matching the 2030 level in the federal benchmark schedule announced in 2020.
The three pathways
The team has reduced the options to three pathways for 2040, each sized to deliver Northgate's 210 GWh of heat a year and to meet its 80 MW peak with firm capacity, and each including the 20,000 m³ storage tank recommended in lesson 11 and the existing gas boilers kept for peaks and backup. Pathway A is the reference: continue with gas boilers alone, because lesson 4 showed that gas cogeneration adds carbon on the Manitoba grid. Pathway B builds large heat pumps drawing heat from the Red River and the city's treated wastewater, about 40 MW of heat in several units, with electric boilers and the tank to keep them off the grid's peak hours; heat pumps supply about 82 percent of the heat. Pathway C combines a 15 MW biomass boiler burning residues for about a third of the heat with smaller heat pumps for over half; gas supplies the last tenth in both B and C.
# Northgate's 2040 pathways: levelized cost of heat and cumulative CO2 to 2040
SITE = 'ca'
cur = 'CAD'
r, N = 0.05, 25
crf = r*(1 + r)**N/((1 + r)**N - 1)
heat = 210.0e3                   # MWh of heat delivered per year
p = {'ca': dict(gas=38.0, elec=60.0, carbon=0.0, grid=[0.002]*15),
     'us': dict(gas=32.0, elec=75.0, carbon=0.0, grid=[0.304 - 0.304*min(1, i/14) for i in range(15)])}[SITE]
# price of gas per MWh (HHV), electricity per MWh for a large customer; grid factor by year 2026..2040
# Pathway definitions: capital (millions), heat shares by source, and conversion efficiencies
paths = {
 'A gas boilers + engine CHP': dict(capex=34.0, shares={'CHP': 0.42, 'gas boiler': 0.58}),
 'B river heat pumps + electric boilers + storage': dict(capex=118.0, shares={'heat pump': 0.82, 'electric boiler': 0.08, 'gas boiler': 0.10}),
 'C biomass + heat pumps': dict(capex=96.0, shares={'biomass': 0.35, 'heat pump': 0.55, 'gas boiler': 0.10}),
}
if SITE == 'ca':
    del paths['A gas boilers + engine CHP']
    paths = {'A gas boilers only (reference)': dict(capex=6.0, shares={'gas boiler': 1.0}), **paths}
chips = 26.0                     # per MWh of chip fuel (LHV)
def year_cost_co2(shares, g):
    cost = co2 = 0.0
    for src, f in shares.items():
        q = heat*f
        if src == 'gas boiler': cost += q/0.88*p['gas']; co2 += q/0.88*0.181
        if src == 'CHP':
            fuel = q/0.44; e = fuel*0.42
            cost += fuel*p['gas'] - e*p['elec']*0.8; co2 += fuel*0.181 - e*g*1000/1000
        if src == 'heat pump': e = q/3.0; cost += e*p['elec']; co2 += e*g
        if src == 'electric boiler': e = q/0.99; cost += e*p['elec']*0.6; co2 += e*g
        if src == 'biomass': cost += q/0.85*chips
    return cost, co2       # currency per year, tonnes per year (q in MWh, factor t/MWh)
print(f"Capital recovery factor at {r*100:.0f} % over {N} years: {crf:.4f}")
res = {}
for name, d in paths.items():
    cum = 0.0; tot = 0.0
    for i in range(15):
        c, e = year_cost_co2(d['shares'], p['grid'][i]); cum += e; tot += c
    lcoh = (d['capex']*1e6*crf + tot/15 + 0.02*d['capex']*1e6)/heat
    res[name] = (lcoh, cum)
    print(f"{name:48s}: {lcoh:5.1f} {cur}/MWh, CO2 2026-2040 {cum/1000:4.0f} kt, in 2040 {e/1000:4.1f} kt/yr")
print("\nWith an internal carbon price applied to the average CO2 of 2026-2040:")
for cp in (0, 65, 170):
    row = '  '.join(f"{n[0]} {l + cp*cum/15/heat:5.1f}" for n, (l, cum) in res.items())
    best = min(res, key=lambda n: res[n][0] + cp*res[n][1]/15/heat)
print(f" {cp:3d} {cur}/t: {row} lowest: {best[0]}")Capital recovery factor at 5 % over 25 years: 0.0710
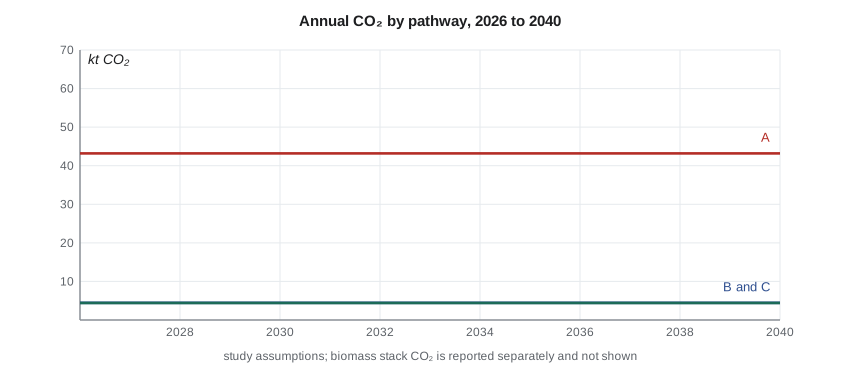
A gas boilers only (reference) : 45.8 CAD/MWh, CO2 2026-2040 648 kt, in 2040 43.2 kt/yr
B river heat pumps + electric boilers + storage : 74.7 CAD/MWh, CO2 2026-2040 67 kt, in 2040 4.5 kt/yr
C biomass + heat pumps : 67.6 CAD/MWh, CO2 2026-2040 66 kt, in 2040 4.4 kt/yr
With an internal carbon price applied to the average CO2 of 2026-2040:
0 CAD/t: A 45.8 B 74.7 C 67.6 lowest: A
65 CAD/t: A 59.1 B 76.1 C 69.0 lowest: A
170 CAD/t: A 80.7 B 78.4 C 71.2 lowest: C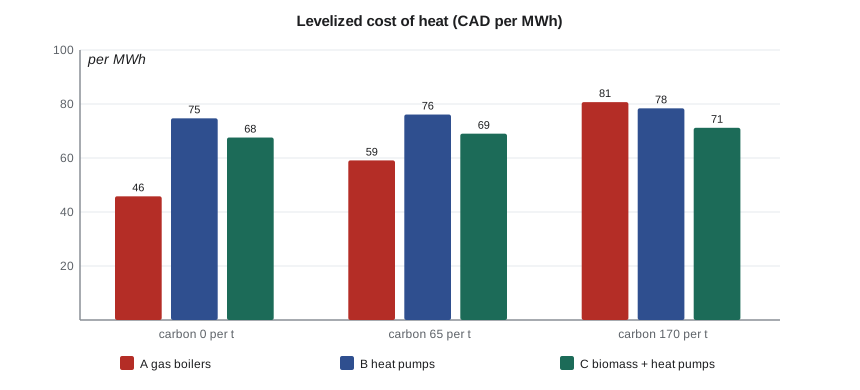
The results tell a clear story. Without a carbon price, pathway A is cheapest by a wide margin, because Northgate's gas plant is already built and gas is cheap. It is also incompatible with the board's commitment: it emits about 650 kt of carbon dioxide from 2026 to 2040 and still 43 kt a year in 2040, against about 70 kt in total for either low-carbon pathway. At an internal carbon price of 170 per tonne, the ranking changes and pathway C becomes the cheapest, with B close behind in Canada. The difference between B and C is smaller than the uncertainty in the inputs.
Risk and robustness
A good plan does not depend on getting every price right. The team tests each pathway against the uncertainties that matter most and asks which decisions are robust, meaning they look sensible across a wide range of futures, and which can be delayed until more is known.
| Uncertainty | Pathway A (gas) | Pathway B (heat pumps) | Pathway C (biomass and heat pumps) |
|---|---|---|---|
| Gas price doubles | Cost rises sharply | Little effect | Little effect |
| Electricity price rises 50 percent | Little effect | Cost rises moderately | Smaller rise |
| Carbon price of 170 per tonne | Most expensive | Competitive | Cheapest |
| Grid decarbonizes slowly | Little effect | Higher early emissions | Smaller effect |
| Residue biomass supply limited | No effect | No effect | Must scale back biomass |
| Biomass carbon accounting tightens | No effect | No effect | Stack CO₂ may be counted |
| Heat pump costs fall | No effect | Cost falls | Cost falls a little |
Three decisions are robust. The storage tank is cheap and useful in every pathway. Heat pumps on the river and wastewater appear in both low-carbon pathways and are needed whichever is chosen. Keeping the existing gas boilers as peaking and backup plant costs little and protects the network on the design day. The biomass decision is less robust: it depends on a fuel supply, on air-quality permits and on how biogenic carbon will be counted, and it can be made later without delaying the heat pumps.
The team's recommendation
Elena's recommendation to the board follows from the analysis. First, build the 20,000 m³ storage tank by 2028. Second, install the first 20 MW of river and wastewater heat pumps by 2030 and a further 20 MW by 2034, coordinating with Manitoba Hydro on supply and on load control during system peaks. Third, commission a study of residue biomass supply within 150 km and of the air permit for a 15 MW boiler, and decide by 2030 whether to build it. Fourth, do not build gas cogeneration. Fifth, keep the gas boilers for peaks, and arrange to buy renewable natural gas for their few hundred hours a year by the late 2030s. The plan reaches about 90 percent fossil-free heat by 2035 and removes most of the remaining gas by 2040 through renewable natural gas, with a review every three years to update prices, the grid factor and technology costs.
Worked problem
Capital recovery and the cost of heat from heat pumps
The first 20 MW of heat pumps cost 50 million and supply 100 GWh of heat a year at a seasonal coefficient of performance of 3.0. Electricity costs 60 per MWh and maintenance is 2 percent of capital a year. Find the levelized cost of heat at a 5 percent discount rate over 25 years, and at 8 percent.
Show solution
- At 5 percent: CRF = 0.0710. Capital charge \(0.0710 \times 50 = 3.55\) million; maintenance 1.00 million; electricity \(100{,}000/3.0 \times 60 = 2.00\) million.
- Cost of heat: \((3.55 + 1.00 + 2.00) \times 10^6/100{,}000 = 65.5\) per MWh.
- At 8 percent: CRF = 0.0937, capital charge 4.68 million, cost of heat 76.8 per MWh.
Answer: Raising the discount rate from 5 to 8 percent adds about 11 per MWh, because more than half the cost of heat pump heat is capital. Public financing at low rates makes a large difference to capital-intensive low-carbon options.
Communicating the plan
The board will not read the calculations. Elena's report therefore leads with the decision and the reasons in plain language, shows the three pathways on one page with cost and carbon side by side, states every major assumption and its source, shows how the recommendation changes if the assumptions change, and separates the steps the board must approve now from those that can wait. Engineers often lose arguments they should win by presenting a mass of numbers without a clear answer, or by hiding the uncertainty that the board will discover later. Stating uncertainty plainly builds trust.
This course has followed one utility's decision, but the method is general. Describe the system and its demand, characterize each technology at the level of real plant, compare options on levelized cost, carbon and firm capacity over their whole lives, test the comparison against uncertainty, act first on the robust decisions, and keep the plan under review. The technologies will keep changing; that method will not.
Common mistakes
MistakeComparing options on capital cost alone.
InsteadCompare levelized cost including operation, maintenance, fuel and the effect of the discount rate.
MistakeUsing a single carbon price or grid projection.
InsteadTest the ranking across a range and report which conclusions are robust.
MistakeIgnoring firm capacity when comparing energy-based options.
InsteadCheck every pathway against the design-day peak.
MistakePresenting the analysis without a clear recommendation.
InsteadLead with the decision and the reasons, then show the evidence and the uncertainties.
MistakeCommitting to every step at once.
InsteadMake robust decisions now and keep options open where information is still coming.
Summary and key terms
- The levelized cost combines capital, through the capital recovery factor, with annual costs, divided by annual output.
- Higher discount rates favour low-capital, high-running-cost options such as gas boilers.
- Canada's consumer carbon charge ended in 2025, but industrial pricing continues and the benchmark is under review.
- Without a carbon price gas is cheapest; with a high internal carbon price the low-carbon pathways become competitive or cheaper.
- The storage tank, the first heat pumps and keeping gas boilers for peaks are robust decisions; the biomass decision waits for a supply study.
- A good plan states its assumptions, tests them and is reviewed regularly.
- Levelized cost of energy
- Lifetime cost of a plant expressed per unit of energy delivered.
- Capital recovery factor
- The fraction of capital cost that, paid each year for the life of an asset, repays it with interest.
- Discount rate
- The rate used to convert future costs and revenues to present value.
- Externality
- A cost or benefit not reflected in market prices, such as pollution damage.
- Internal carbon price
- A price per tonne of carbon dioxide that an organization applies in its own planning.
- Output-based pricing
- Carbon pricing for industry in which emitters pay on emissions above an output-based benchmark.
- Robust decision
- A decision that performs acceptably across a wide range of possible futures.
- Pathway
- A coherent sequence of investments leading to a target state of the energy system.
Practice problems
Work each problem on paper first, then reveal the answer to check.
Find the capital recovery factor at 7 percent over 20 years.
Show answer
\(0.07 \times 1.07^{20}/(1.07^{20} - 1) = 0.0944\).
A wind farm costs 60 million, produces 170 GWh a year and has O&M of 1.5 million a year. Find its LCOE at a CRF of 0.0944.
Show answer
\((5.66 + 1.5) \times 10^6/170{,}000 = 42\) per MWh.
Pathway A emits 43 kt a year; pathway B emits 4.5 kt. What carbon price per tonne would add 7.9 per MWh to A's cost relative to B for 210 GWh of heat?
Show answer
\(7.9 \times 210{,}000/38{,}500 = 43\) per tonne.
Why does a higher discount rate penalize heat pumps more than gas boilers?
Show answer
More of the heat pumps' cost is capital, which the discount rate raises; gas boilers' cost is mostly fuel.
Name a robust decision in the team's plan and explain why it is robust.
Show answer
The storage tank: it is cheap and valuable in every pathway and every future the team considered.
Lesson quiz · 5 questions
Score 60% or more to complete this lesson.
Create a free account to save your progress, take quizzes and earn a certificate.