
GEOM-210 · Lesson 5 of 12 · 25 min
Profiles, cross-sections and earthwork volumes
Roads, pipelines, channels and ponds are designed in three dimensions, but engineers usually think about them in slices. A profile is a vertical section along the centreline of an alignment, showing the existing ground and the proposed grade. Cross-sections are vertical slices at right angles to the centreline, showing the ground across the corridor and the proposed shape of the road, ditch or embankment. Comparing the existing ground with the design in these slices gives the cuts and fills that contractors must build and the volumes of earth to be moved, which often control the cost of a project. This lesson covers profile and cross-section surveys, stationing, plotting, cut and fill, and the standard methods for computing earthwork volumes.
On the Coulee Ridge Drive extension, Leah helps run a profile along the proposed centreline and cross-sections every 20 m. Theo's drone survey, covered in lesson 11, gives a surface model of the whole site, but the field profile is a useful check and is still the standard method for many municipal and rural projects. The same methods are used for the stormwater pond, where a grid survey gives the volume of excavation.
Stationing
Positions along an alignment are given by stations, measured from the beginning of the alignment along the centreline. In metric practice, stations are written as kilometres plus metres, so station 0+060 is 60 m from the start and station 1+234.560 is 1,234.560 m from the start. Full stations are usually set every 20 m on roads, with additional stations, called plus stations, at breaks in the ground, intersections, culverts and the beginning and end of curves. An offset is the perpendicular distance left or right of the centreline, so a point described as station 0+040, 8.5 m right, is 8.5 m to the right of the centreline at 40 m from the start, looking in the direction of increasing stations.
Profile levelling
Profile levelling is differential levelling along the centreline with many intermediate sights. From each setup, the crew takes rod readings at every station and at every significant break in the ground within reach, then moves forward on turning points. Each intermediate sight elevation equals the height of instrument minus the rod reading. The run begins and ends on benchmarks so that it can be checked for closure, just like any level run; the intermediate sights do not affect the closure, which is why a gross mistake in an intermediate reading can pass unnoticed unless the profile is plotted and checked for odd spikes.
Profiles are plotted with a large vertical exaggeration, often ten times, so that small changes in elevation are visible. The horizontal axis is stationing and the vertical axis is elevation. The designer draws a proposed grade line made of straight tangents joined by vertical curves (lesson 12), and the difference between ground and grade at each station is the centreline cut or fill.
A grade \(g\) is a slope expressed as a decimal or percentage, positive uphill in the direction of increasing stations and negative downhill. A grade of −1.5 per cent falls 1.5 m per 100 m.
Worked problem
Centreline cut and fill
The proposed grade of Coulee Ridge Drive starts at elevation 914.200 m at station 0+000 and falls at −1.5 per cent. Ground elevations from the profile survey are 914.62 at 0+000, 914.95 at 0+020, 915.30 at 0+040, 914.88 at 0+060, 914.31 at 0+080 and 913.72 at 0+100. Find the cut or fill at each station.
Show solution
- Grade elevations fall 0.30 m every 20 m: 914.200, 913.900, 913.600, 913.300, 913.000, 912.700.
- Cuts are ground minus grade: 0.42, 1.05, 1.70, 1.58, 1.31 and 1.02 m.
Answer: Every station is in cut, with the deepest cut of 1.70 m at 0+040 where the road passes through a low rise. Positive values are cuts and negative values would be fills.
Cross-sections
At each station, the crew measures ground elevations at right angles to the centreline, out to beyond the limits of construction, at every break in slope. The result is a ground line for each cross-section. The designer overlays a template: the proposed road surface, shoulders, ditches and side slopes. Side slopes are written as a ratio of horizontal to vertical, such as 3:1 for a gentle slope that can be mowed, or 2:1 for a steeper embankment. The points where the side slopes meet the existing ground are the catch points, or slope stakes, which define the limits of the earthwork and are marked in the field during construction (lesson 12).
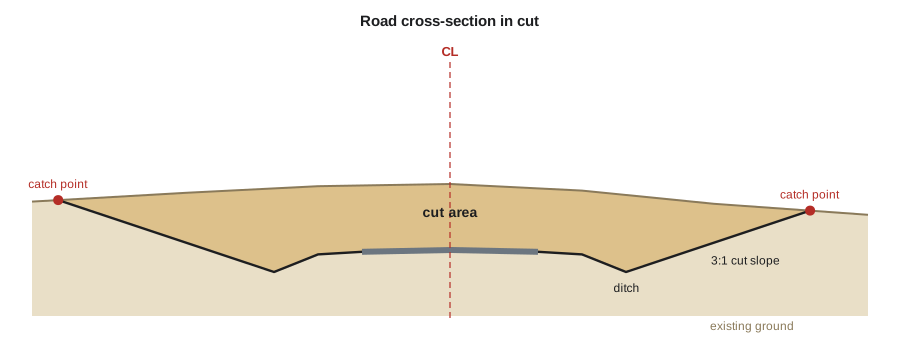
The area of each cross-section, in cut and in fill separately, is computed from the coordinates of its corners, with offset as the horizontal coordinate and elevation as the vertical coordinate. The coordinate method, explained for parcels in lesson 8, works for any polygon. For simple shapes, the section can also be divided into trapezoids and triangles. Software does this automatically from digital terrain models, but the logic is the same.
Volumes by average end area
The most widely used method for road and pipeline earthwork is the average end area method. The volume between two cross-sections is the average of their areas times the distance between them.
The method is exact if the cross-sections change linearly between stations, which they rarely do, and it usually overestimates the volume slightly. Where greater accuracy is needed, the prismoidal formula uses the area of a middle section \(A_m\), measured or computed halfway between the end sections (not the average of the end areas):
When a section changes from cut to fill, the earthwork forms a wedge or pyramid rather than a prism, and the volume is computed as a pyramid, one third of the base area times the length, or by adding a section at the transition point where the cut area becomes zero.
Worked problem
Volume between two stations
At station 0+040 the cut area is 18.6 m², and at station 0+060 it is 24.2 m². A section computed at 0+050 has a cut area of 21.2 m². Find the volume by average end areas and by the prismoidal formula.
Show solution
- \[V_{AEA} = \frac{20}{2}(18.6 + 24.2) = 428.0\ \text{m}^3\]
- \[V_{prism} = \frac{20}{6}(18.6 + 4 \times 21.2 + 24.2) = 425.3\ \text{m}^3\]
Answer: The average end area gives 428.0 m³ and the prismoidal formula 425.3 m³, a difference of less than 1 per cent. For most earthwork estimates the average end area result is accepted.
Volumes by the grid method
For ponds, building pads, borrow pits and stockpiles, a grid method is often more convenient than cross-sections. The area is divided into squares or rectangles of equal size, and the depth of cut or fill is determined at every grid corner. Each grid cell is treated as a prism whose volume is its area times the average of its four corner depths. Interior corners are shared by several cells, so the total volume can be computed by weighting each corner depth by the number of cells that use it:
where \(A\) is the area of one cell and \(h_n\) are depths at corners shared by \(n\) cells. Corners at the outside of the grid belong to one cell, edge points to two, and interior points to four; points at an inside corner of an irregular grid belong to three.
Worked problem
Excavation volume for the stormwater pond
The pond area is covered by a grid of 3 × 2 cells, each 10 m × 10 m, giving 4 × 3 corner points. The depths of cut, row by row, are 1.20, 1.45, 1.62, 1.38; 1.55, 1.84, 1.97, 1.60; and 1.31, 1.52, 1.70, 1.42 m. Find the excavation volume.
Show solution
- Corner points (used once): \(1.20 + 1.38 + 1.31 + 1.42 = 5.31\).
- Edge points (used twice): \(1.45 + 1.62 + 1.55 + 1.60 + 1.52 + 1.70 = 9.44\).
- Interior points (used four times): \(1.84 + 1.97 = 3.81\).
- \[V = \frac{100}{4}(5.31 + 2 \times 9.44 + 4 \times 3.81) = 25 \times 39.43 = 985.8\ \text{m}^3\]
Answer: The excavation is about 986 m³ of in-place (bank) material.
# Cut and fill along the profile, end-area volumes and the grid method (metric)
stations = [0, 20, 40, 60, 80, 100]
ground = [914.62, 914.95, 915.30, 914.88, 914.31, 913.72]
z0, g = 914.200, -0.015
for s, e in zip(stations, ground):
    grade = z0 + g * s
    print(f"0+{s:03d}  ground {e:8.2f}  grade {grade:8.3f}  cut {e - grade:5.2f}")

A1, Am, A2, L = 18.6, 21.2, 24.2, 20
print(f"average end area: {L / 2 * (A1 + A2):.1f} m3; prismoidal: {L / 6 * (A1 + 4 * Am + A2):.1f} m3")

def grid_volume(h, cell_area):
    rows, cols = len(h), len(h[0])
    total = 0
    for i in range(rows):
        for j in range(cols):
            n = sum(1 for di in (0, -1) for dj in (0, -1)
                    if 0 <= i + di < rows - 1 and 0 <= j + dj < cols - 1)
            total += n * h[i][j]
    return cell_area / 4 * total

pond = [[1.20, 1.45, 1.62, 1.38], [1.55, 1.84, 1.97, 1.60], [1.31, 1.52, 1.70, 1.42]]
bank = grid_volume(pond, 10 * 10)
print(f"pond excavation: {bank:.1f} bank m3, about {bank * 1.25:.0f} loose m3 to haul at 25% swell")0+000 ground 914.62 grade 914.200 cut 0.42 0+020 ground 914.95 grade 913.900 cut 1.05 0+040 ground 915.30 grade 913.600 cut 1.70 0+060 ground 914.88 grade 913.300 cut 1.58 0+080 ground 914.31 grade 913.000 cut 1.31 0+100 ground 913.72 grade 912.700 cut 1.02 average end area: 428.0 m3; prismoidal: 425.3 m3 pond excavation: 985.8 bank m3, about 1232 loose m3 to haul at 25% swell
Bank, loose and compacted volumes
A cubic metre of soil in the ground, called bank or in-place volume, does not stay a cubic metre. When excavated it loosens and occupies more space, typically 10 to 40 per cent more depending on the material; this increase is called swell, and it governs how many truckloads are needed. When placed and compacted in an embankment, it usually occupies less space than in the bank, typically by 5 to 20 per cent; this is called shrinkage. Rock behaves differently and usually swells permanently. Earthwork balances must therefore convert all volumes to a common basis, and contracts must state whether payment is for bank, loose or compacted volume.
A mass haul diagram plots the cumulative volume of earthwork along an alignment, with cuts positive and fills negative after applying shrinkage factors. Rising parts of the curve show cut, falling parts show fill, and a horizontal line drawn across the curve, called a balance line, shows stretches where cut and fill balance. The diagram helps designers adjust the grade line to reduce the volume of material that must be imported or wasted, and helps contractors plan haul distances.
Surfaces and modern methods
Most volumes today are computed from digital terrain models. A triangulated irregular network (TIN) connects surveyed points with triangles to represent the ground surface. The volume between two surfaces, such as existing ground and design, or the same stockpile surveyed in two different months, is computed by comparing the surfaces over a common area. Drone photogrammetry and lidar, discussed in lesson 11, can measure millions of points in an hour, which is ideal for stockpiles and large earthworks. Field profiles, cross-sections and grid shots remain important for checking those surfaces, for small jobs and wherever vegetation hides the ground.
Whatever the method, the quality of the volume depends on the quality of the surfaces. Missing a ditch bottom, a crest of a berm or a break in slope can change the result more than the choice of formula. Surveyors therefore pay particular attention to breaklines, lines along which the ground changes slope sharply, and include them in surface models so that triangles do not cut across them.
Common mistakes
MistakeIncluding intermediate sight readings in the level run closure check.
InsteadClosure uses only backsights and foresights on turning points and benchmarks; check intermediate sights by plotting the profile.
MistakeUsing the average of the end areas as the middle area in the prismoidal formula.
InsteadThe middle area must be measured or computed at the midpoint; averaging end areas just reproduces the average end area result.
MistakeAdding bank and compacted volumes directly in an earthwork balance.
InsteadConvert all volumes to a common basis using swell and shrinkage factors.
MistakeBuilding a terrain model without breaklines.
InsteadSurvey and include breaklines such as ditch bottoms and crests so the surface follows the real ground.
Summary and key terms
- A profile is a section along the centreline; cross-sections are at right angles; stations and offsets locate points.
- Profile levelling uses many intermediate sights; the run still closes on benchmarks.
- Grade elevation equals the starting elevation plus the grade times the distance; cut equals ground minus grade.
- Average end area volume is L(A1 + A2)/2; the prismoidal formula uses a measured middle area.
- The grid method weights corner depths by the number of cells sharing each corner.
- Earthwork volumes must account for swell and shrinkage, and modern volumes come from surface models built with breaklines.
- Profile
- A vertical section along an alignment showing existing ground and proposed grade.
- Cross-section
- A vertical section at right angles to an alignment.
- Station
- A distance along an alignment from its beginning.
- Offset
- A perpendicular distance left or right of an alignment.
- Catch point
- The point where a design side slope meets the existing ground.
- Average end area method
- A volume method that multiplies the average of two cross-section areas by the distance between them.
- Swell
- The increase in volume of soil when it is excavated and loosened.
- Breakline
- A line along which the ground surface changes slope sharply, used to control a terrain model.
Practice problems
Work each problem on paper first, then reveal the answer to check.
A grade of +2.0 per cent starts at elevation 120.000 m at station 0+000. What is the grade elevation at station 0+075?
Show answer
\(120.000 + 0.02 \times 75 = 121.500\) m.
End areas of 35 m² and 41 m² are 20 m apart. Find the volume by average end areas.
Show answer
\(10 \times 76 = 760\) m³.
A cut area of 12 m² shrinks to zero over 15 m, with both its width and depth shrinking so that it tapers to a point like a pyramid. Estimate the volume.
Show answer
As a pyramid, one third of the base area times the length: \(12 \times 15/3 = 60\) m³. The average end area method would give 90 m³ and overestimate.
How many 10 m³ truckloads are needed for 986 bank m³ with 25 per cent swell?
Show answer
\(986 \times 1.25/10 = 123.3\), so 124 loads.
Why is a profile plotted with vertical exaggeration?
Show answer
Elevation changes are small compared with horizontal distances and would be invisible at true scale.
What does a horizontal balance line on a mass haul diagram show?
Show answer
A stretch of the alignment over which cut and fill volumes balance.
Lesson quiz · 5 questions
Score 60% or more to complete this lesson.
Create a free account to save your progress, take quizzes and earn a certificate.