
ENGG-160 · Lesson 1 of 5 · 42 min
The engineering design process
Design is what engineers are paid for. Analysis (the statics, circuits and chemistry of first year) tells you whether a proposed solution will work. Design is how the solution gets proposed in the first place. It is the process of turning a need, often stated vaguely by someone who is not an engineer, into a specific, buildable, tested thing.
ENGG-100 introduced the design cycle and the weighted decision matrix. This course goes deeper and makes the process practical. Through all five lessons we will follow one project: making the entrance of an older community centre accessible to everyone. This chapter covers how to frame the problem, find root causes, generate many concepts, screen and select them, test whether a decision is robust, and use prototypes and testing to learn before committing.
Why a process at all?
Experienced designers sometimes seem to leap straight to a good answer. In reality they are running through the same steps quickly and from memory. A deliberate process helps in three ways. It stops the team from falling in love with the first idea, which is rarely the best one. It makes the reasoning visible, so a client, regulator or reviewer can see why a choice was made. And it scales: a five-person student team and a five-hundred-person aircraft program both need a shared idea of what stage the work is at.
Many models of the design process exist. They differ in the number of boxes but share a core sequence: understand the problem, generate options, choose, develop, test and deliver, with loops back whenever something learned later changes an earlier decision.
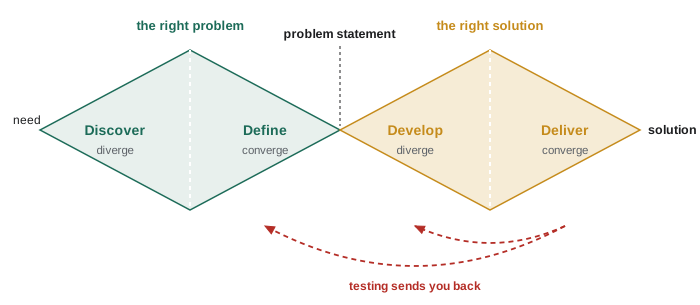
The double diamond, popularized by the UK Design Council in the mid-2000s, captures an idea that the simple cycle hides: good design alternates between diverging (opening up, generating many possibilities) and converging (narrowing down, deciding). Teams get into trouble when they converge too early, picking a solution before the problem is understood, or never converge at all.
Large engineering organizations formalize the same idea as a stage-gate process: work proceeds in stages (concept, preliminary design, detailed design, construction) separated by gates where a review board decides whether to continue, revise or stop. You will see this in practice as design reviews, covered in Lesson 5.
Stage 1: frame the problem
The single most expensive mistake in design is solving the wrong problem. Clients usually describe a solution, not a need: "we need a ramp", "make the pump bigger", "add another lane". The engineer's first job is to dig underneath the request to the need it is meant to satisfy.
A good problem statement is solution-neutral. It describes who has the problem, what they cannot do, and what success would look like, without naming a particular solution. That leaves room for answers the client has not thought of.
Worked problem
Reframing the request
The community centre's board writes: "We need a ramp at the front entrance." Rewrite this as a solution-neutral problem statement and list at least four different kinds of solution it opens up.
Show solution
- Ask what the ramp is for. The board explains that the front entrance is 600 mm above the sidewalk, reached by four steps, and that people using wheelchairs, walkers and strollers, and some older members, cannot get in without help.
- Problem statement: "People who cannot climb steps are unable to enter the community centre independently. We need a way for everyone to enter through a main entrance, year-round, without assistance."
- Solution families this opens up: (1) a ramp; (2) a vertical platform lift; (3) regrading the approach so the sidewalk rises gently to the door; (4) making a different, level entrance the main entrance; (5) combinations, such as a short ramp plus regrading.
Answer: The reframed statement names the users, the barrier and the measure of success ("independently, year-round, through a main entrance"). It lets the team compare a ramp against alternatives instead of assuming it
Notice the phrase "year-round". It came from asking the board follow-up questions, and it will matter: a ramp that ices up in January fails the need even if it meets every dimension in the building code.
Finding root causes
When the problem is a failure or a recurring complaint, the visible symptom is rarely the real cause. The "five whys" technique, developed at Toyota, asks "why?" repeatedly until you reach something you can actually fix. Five is a rule of thumb, not a requirement.
Worked problem
Five whys on icy steps
Staff report that the existing front steps are dangerously icy most winter mornings. Use the five whys to find a root cause.
Show solution
- Why are the steps icy? Water freezes on them overnight.
- Why is there water on them? Meltwater runs onto them during the day.
- Why does meltwater reach the steps? The roof downspout beside the door discharges onto the landing.
- Why does it discharge there? The original drain connection was blocked years ago and the downspout was cut short.
- Why was it never fixed? No one owns exterior maintenance in the building's service contract.
Answer: The root causes are a disconnected downspout and a gap in maintenance responsibility. Salting the steps treats the symptom. Any new entrance design must also re-route the roof water, or it will ice up exactly like the old steps
Research before inventing
Most problems have been partly solved before. Before generating concepts, look at how others have handled similar needs: competitor products, published case studies, codes and standards (which encode lessons from past failures), and patents. A patent search can reveal both good ideas and protected ones you must not copy. Benchmarking, the systematic comparison of existing solutions against your requirements, turns that research into a table you can learn from.
Stage 2: generate many concepts
Quantity first. Studies of design teams consistently find that teams who generate more concepts early end up with better final designs, partly because good ideas often come from combining or modifying weak ones. Two habits help.
- Brainstorming with rules: defer judgment, aim for quantity, build on others' ideas, welcome odd ones. Writing ideas silently first, then sharing (sometimes called brainwriting), stops the loudest person from steering the group.
- Functional decomposition: break the problem into the functions the design must perform, generate options for each function separately, then combine them.
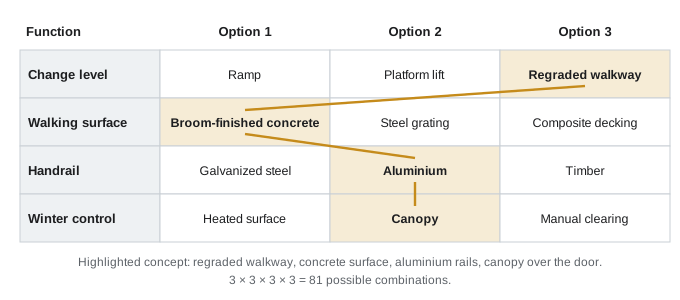
The second habit leads to a powerful tool, the morphological chart. List each function as a row and the ways of achieving it as columns. Any choice of one option per row is a candidate concept.
Worked problem
Counting concepts
The entrance team's morphological chart has four functions with three options each. How many combinations are there? If the team rules out steel grating (uncomfortable for canes and some wheels) and heated surfaces (too costly to run), how many remain?
Show solution
- Total combinations: \(3 \times 3 \times 3 \times 3 = 81\).
- Removing one option from the surface row and one from the winter row: \(3 \times 2 \times 3 \times 2 = 36\).
Answer: 81 combinations, reduced to 36 by two early decisions. Many will still be poor matches (a platform lift does not need a walking surface), so the chart is a prompt for thinking, not a list to evaluate exhaustively
Stage 3: screen, then select
With dozens of candidates, evaluating each in detail is impossible. Selection usually happens in two passes.
Screening with a Pugh matrix
The Pugh method, developed by Stuart Pugh, compares each concept against one reference concept (the datum), criterion by criterion: better (+), same (0) or worse (−). There are no weights and no fine scores; the point is to discuss each comparison, drop clear losers, and spot ways to combine strengths.
Worked problem
Pugh screening
Using a conventional concrete ramp as the datum, compare a platform lift, a regraded walkway and a steel modular ramp on five criteria: capital cost, independent use, winter performance, maintenance and appearance. The team's judgments: lift (−, 0, +, −, +); walkway (−, +, 0, +, +); steel ramp (+, 0, −, −, −).
Show solution
- Lift: pluses 2 (winter, appearance), minuses 2 (cost, maintenance). Net 0.
- Walkway: pluses 3 (independent use, maintenance, appearance), minuses 1 (cost). Net +2.
- Steel ramp: pluses 1 (cost), minuses 3 (winter, maintenance, appearance). Net −2.
Answer: Drop the steel ramp. Carry the walkway and lift forward with the concrete ramp. The discussion also suggests a hybrid: regrade partway and use a much shorter ramp, keeping most of the walkway's benefits at lower cost
Weighted selection and sensitivity
For the final few concepts, a weighted decision matrix (from ENGG-100) puts numbers on the comparison. Each criterion gets a weight reflecting its importance, each concept a score on each criterion, and the weighted sums are compared.
Worked problem
Weighted decision
Weights: cost 0.35, usability 0.30, winter maintenance 0.20, appearance 0.15. Scores out of 10: ramp (7, 8, 5, 6); lift (5, 6, 8, 7); walkway (4, 10, 6, 9). Which concept ranks first?
Show solution
- Ramp: \(0.35(7) + 0.30(8) + 0.20(5) + 0.15(6) = 2.45 + 2.40 + 1.00 + 0.90 = 6.75\).
- Lift: \(1.75 + 1.80 + 1.60 + 1.05 = 6.20\).
- Walkway: \(1.40 + 3.00 + 1.20 + 1.35 = 6.95\).
Answer: Walkway 6.95, ramp 6.75, lift 6.20. The walkway leads, but only by 0.20 points
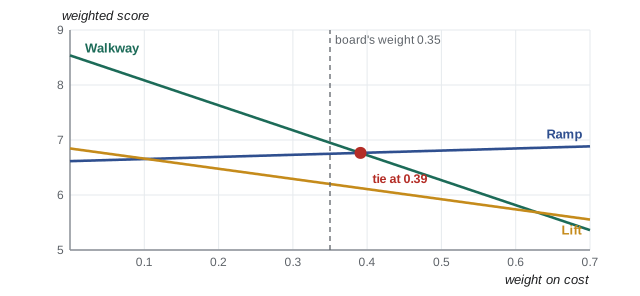
A lead of 0.20 out of 10 is well inside the uncertainty of the scores themselves. Before recommending the walkway, the team should ask whether the ranking survives reasonable changes in the weights. That check is called a sensitivity analysis.
Worked problem
Where does the decision flip?
Vary the cost weight \(c\), scaling the other three weights so that all four still add to 1 and keep their original proportions. At what value of \(c\) do the ramp and walkway tie?
Show solution
- The other weights total 0.65 originally, in proportions 0.30 : 0.20 : 0.15. With cost weight \(c\), they become \((1 - c)\) times \(0.30/0.65\), \(0.20/0.65\) and \(0.15/0.65\).
- Non-cost score of the ramp: \((0.30 \times 8 + 0.20 \times 5 + 0.15 \times 6)/0.65 = 4.30/0.65 = 6.615\).
- Non-cost score of the walkway: \((3.00 + 1.20 + 1.35)/0.65 = 5.55/0.65 = 8.538\).
- \[7c + 6.615(1 - c) = 4c + 8.538(1 - c) \;\Rightarrow\; 3c = 1.923(1 - c) \;\Rightarrow\; c = 0.391\]
Answer: The decision flips at a cost weight of 0.39. At the board's weight of 0.35 the walkway wins, but a modest shift toward cost would favour the ramp. The recommendation should say so plainly and ask the board to confirm how much cost matters
This is how numbers should serve judgment rather than replace it. A decision matrix does not make the decision; it makes the assumptions behind the decision explicit, so the people who own those assumptions can check them.
Stage 4: prototype and test
A prototype is any model built to answer a question. The skill is to build the cheapest prototype that answers the question you have right now.
- Low fidelity: sketches, cardboard mock-ups, tape on the floor. Quick and cheap, for questions about size, layout and how people use something.
- Medium fidelity: 3D-printed parts, foam models, computer simulations. For questions about fit, motion and performance.
- High fidelity: a working unit made with production materials and methods. For final verification, certification testing and manufacturing trials.
For the entrance, the team marked the regraded walkway's outline in chalk on the sidewalk and watched members walk, push strollers and use wheelchairs along it. They learned in one afternoon that the planned turn near the door was too tight for a mobility scooter, something no drawing review had caught.
How many testers?
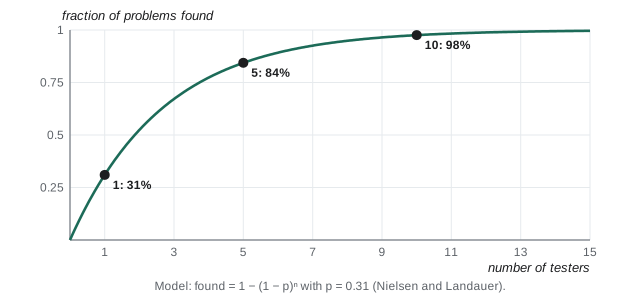
Usability testing with real users finds problems that designers cannot see. A widely used model from Nielsen and Landauer assumes each tester reveals a given problem with probability \(p\), typically about 0.31 in software studies. The fraction of problems found by \(n\) independent testers is then
Worked problem
Planning a test round
With \(p = 0.31\), what fraction of problems do 5 testers find? How many testers are needed to find 95%?
Show solution
- \(1 - 0.69^5 = 1 - 0.156 = 0.844\), about 84%.
- For 95%: \(0.69^n \le 0.05\), so \(n \ge \ln 0.05/\ln 0.69 = 8.08\). Nine testers.
Answer: About 84% with five testers; nine for 95%. Because the curve flattens, it is usually better to test with five, fix what they found, and test again with five new people
Take the exact numbers lightly. The value of \(p\) varies a great deal between products and user groups, and accessibility testing in particular needs testers with a range of disabilities, since one wheelchair user cannot represent everyone. The lesson that survives is the shape of the curve: early, small, repeated tests pay off.
Stage 5: iterate, then deliver
Every test teaches something, and much of what it teaches sends you back to an earlier stage. James Dyson famously built 5,127 prototypes of his cyclonic vacuum cleaner before he had one he was happy with. That is extreme, but the principle is universal: iteration is not a sign that the first design failed; it is how design works. The cost of a change rises steeply as a project moves from concept to detailed design to construction, so iterate hardest early, when changes are cheap.
Delivery means more than building the thing. It includes the drawings and specifications that let someone else build it (Lesson 3), the report that explains and justifies it (Lesson 4), the commissioning tests that show it works, and the operating and maintenance information that keeps it working. For the entrance, that includes the new downspout routing found by the five whys, and a clear assignment of who clears snow.
Design for X
Beyond working at all, a design must work across its whole life. Engineers use a family of "design for X" checklists to keep those other goals in view:
- Design for manufacture and assembly: fewer parts, standard fasteners, parts that can only go together one way.
- Design for maintenance: access panels, replaceable wear parts, nothing that needs a crane to change a light bulb.
- Design for accessibility: usable by people of all ages and abilities, which is the whole point of our project.
- Design for sustainability: lower embodied carbon, longer life, reuse and recycling at end of life (ENGG-100, Lesson 5).
- Design for safety: hazards removed by design first, guarded second, warned about last (the hierarchy of controls from ENGG-100).
Common mistakes
MistakeStarting with the client's proposed solution as the problem.
InsteadWrite a solution-neutral problem statement naming the users, the barrier and the measure of success, and get it agreed.
MistakeTreating the first plausible concept as the answer.
InsteadDiverge first: aim for many concepts, using brainstorming and a morphological chart, before converging.
MistakeReporting the top score from a decision matrix as the decision.
InsteadCheck sensitivity. If small changes in weights reorder the concepts, say so and let the decision owners confirm the weights.
MistakeBuilding an expensive prototype to answer an early question.
InsteadUse the lowest fidelity that answers the current question: chalk lines and cardboard before steel and concrete.
MistakeFixing a symptom (salting icy steps) instead of the cause.
InsteadAsk "why?" until you reach something you can change, such as a disconnected downspout.
MistakeTreating iteration as failure.
InsteadPlan for it. Learn early, when changes are cheap.
Summary and key terms
- Design turns a need into a buildable, tested solution; a shared process keeps teams from converging too early and makes reasoning reviewable.
- The double diamond alternates diverging and converging, first on the problem, then on the solution.
- Frame the problem in solution-neutral terms; use the five whys to find root causes; research existing solutions.
- Generate many concepts with brainstorming and functional decomposition; a morphological chart combines options per function.
- Screen with a Pugh matrix against a datum, then select with a weighted matrix and test the result's sensitivity to the weights.
- Prototype at the lowest fidelity that answers the question; small repeated user tests find most problems.
- Iterate early, when change is cheap, and design for the whole life of the product: manufacture, maintenance, accessibility, sustainability and safety.
- Problem statement
- A solution-neutral description of who has a problem, what they cannot do and what success looks like.
- Five whys
- Asking "why?" repeatedly to trace a symptom back to a root cause.
- Divergent thinking
- Generating many possibilities without judging them.
- Convergent thinking
- Evaluating and narrowing options to a decision.
- Morphological chart
- A table of functions and options for each, combined to form concepts.
- Pugh matrix
- A screening table comparing concepts with a datum as better, same or worse.
- Sensitivity analysis
- Checking whether a result changes when uncertain inputs, such as weights, change.
- Prototype
- A model built to answer a design question.
- Fidelity
- How closely a prototype resembles the final product.
- Stage-gate process
- A project divided into stages separated by formal go/no-go reviews.
Practice problems
Work each problem on paper first, then reveal the answer to check.
A city asks for "a bigger culvert" under a road that floods each spring. Write a solution-neutral problem statement and list three other solution types.
Show answer
Example: "The road is closed by flooding most springs. We need the road to stay open during a 1-in-50-year spring runoff." Alternatives: raise the road; add upstream storage (a detention pond); divert part of the flow; add a second culvert; manage ice jams at the inlet.
Apply the five whys to: "Students are late handing in design reports."
Show answer
One possible chain: late reports → finished the night before → sections arrive late from teammates → no internal deadlines → no team schedule agreed at the start. Root cause: no schedule or internal deadlines (Lesson 5 tools fix this).
A morphological chart has rows with 4, 3, 5 and 2 options. How many combinations?
Show answer
4 × 3 × 5 × 2 = 120.
In the Pugh example, what would change if the team used the walkway as the datum instead?
Show answer
Every other concept is now compared with the walkway, so the walkway scores all zeros and the ramp likely scores worse on independent use, maintenance and appearance but better on cost. Changing the datum is a good way to test whether the leader really leads.
Recompute the weighted scores with weights cost 0.45, usability 0.25, winter 0.15, appearance 0.15. Which concept wins?
Show answer
Ramp: 3.15 + 2.00 + 0.75 + 0.90 = 6.80. Lift: 2.25 + 1.50 + 1.20 + 1.05 = 6.00. Walkway: 1.80 + 2.50 + 0.90 + 1.35 = 6.55. The ramp wins.
With the original weights, how much would the walkway's cost score have to drop before the ramp wins?
Show answer
The walkway leads by 0.20. Each point of cost score is worth 0.35, so a drop of 0.20/0.35 = 0.57 points (from 4 to about 3.4) makes them tie.
Choose a prototype fidelity for each question: (a) Is the handrail at a comfortable height? (b) Will the heated mat melt 2 cm/h of snowfall at −20 °C? (c) Does the lift meet its safety certification?
Show answer
(a) Low: a temporary rail at adjustable height. (b) Medium: a heat-transfer calculation or bench test. (c) High: the production unit tested by the certifying body.
Using 1 − (1 − p)ⁿ with p = 0.25, how many testers find at least 80% of problems?
Show answer
0.75ⁿ ≤ 0.20, n ≥ ln 0.2/ln 0.75 = 5.6, so 6 testers.
Give one "design for maintenance" improvement for the entrance.
Show answer
Examples: replaceable handrail sections bolted rather than welded; drainage with a cleanout; lighting fixtures reachable from a step ladder; a canopy gutter sized and accessible for cleaning.
Explain why the cost of a design change rises through a project.
Show answer
Early, a change alters a sketch. Later, it alters many dependent drawings and calculations, may need re-approval, and during construction may mean demolition, rework, delay claims and wasted materials.
Lesson quiz · 5 questions
Score 60% or more to complete this lesson.
Create a free account to save your progress, take quizzes and earn a certificate.