
ELE-490 · Lesson 7 of 12 · 21 min
Interconnection studies and hosting capacity
With the requirements understood, Leo turns to the question every interconnection eventually reaches: can the existing system accept this resource, and if not, what must change? Utilities answer it through a sequence of screens and studies that grows more detailed as a project advances and as the stakes rise. Increasingly they also publish hosting capacity maps that estimate, in advance, how much new generation each part of the system can accept. This lesson walks through the study process, the technical criteria behind it and a first hosting-capacity screen of feeder F2, the feeder Birch Hill proposes to tap.
The interconnection process
Most interconnection processes have the same skeleton. A customer submits an application with technical data: the size and type of resource, inverter certifications, a single-line diagram and a proposed point of interconnection. The utility checks completeness and assigns a queue position. Small, simple projects pass through a set of screens, quick tests of whether the resource could plausibly cause a problem, and if they pass, they proceed to an agreement with minimal study. Projects that fail a screen, or are too large to qualify, go to detailed studies. The studies identify any upgrades the project needs and estimate their cost, which under most North American rules the interconnection customer pays. The process ends with an interconnection agreement, construction, commissioning tests and permission to operate.
In Canada, the process is set by each utility within provincial rules, so it varies between provinces. Small systems usually follow a simplified net metering path, while larger embedded generation projects go through feasibility and system impact studies similar in content to those described below. Larchmont's own process follows that pattern, with screens for small projects and full studies for projects above about 500 kW.
Birch Hill, at 10 MW of export, is far beyond the small-project path. It goes straight to a full study, which Larchmont performs in two stages: a system impact study, which identifies the problems and possible solutions, and a facilities study, which designs the selected solution and estimates its cost. Leo's work this term is the system impact study.
Screens
Screens are simple, conservative tests designed to identify the projects that clearly cannot cause problems. A widely used example, originating in the small generator interconnection procedures that FERC adopted in the mid-2000s, asks whether the total generation on a feeder section, including the new project, is below 15 % of that section's peak load. The logic is that if generation never exceeds the section's minimum load, which is typically a third or so of its peak, power never flows backward and most integration problems cannot arise. Other common screens check that the project's fault contribution is small compared with the protective devices' ratings, that a single-phase generator does not unbalance a transformer, and that the project does not exceed a share of the feeder's capacity.
Screens are conservative on purpose, and as distributed resources grew, many projects that would have caused no problems failed the 15 % screen. Many jurisdictions have therefore added a supplemental review that uses the feeder's measured minimum daytime load in place of a fraction of peak, allowing generation up to 100 % of minimum load before a full study is required. Hosting capacity analysis, discussed below, aims to replace guesswork with a precomputed answer for each location.
What a system impact study examines
A full study tests the project against every limit it might reach. Thermal limits are the current ratings of conductors, cables, transformers and switches, checked with the resource at full output and the load at its minimum. Voltage limits apply to steady-state voltage, which the resource raises at its point of connection and along the feeder, and to rapid voltage change, the step that customers would see if the resource suddenly tripped from full output. Protection is studied for changes in fault current, coordination, sensitivity, sympathetic tripping and islanding. Power quality covers harmonics and flicker. Equipment such as voltage regulators, capacitor banks and the substation tap changer must operate correctly with reverse flow. Finally, the transmission impacts of the aggregate resource at the substation must be checked with the transmission operator.
For each criterion the utility uses a planning limit. A typical steady-state limit is that service voltage stay within the range set by the voltage standard, roughly ±5 % of nominal on a 120 V base for normal conditions, and that the resource itself not raise feeder voltage by more than a few percent. A typical rapid voltage change limit is about 3 % for an infrequent step, tighter for repeated steps because of flicker. Larchmont uses 3 % for both the steady-state rise caused by the project and the step on a sudden trip, which are reasonable planning values but not universal ones.
In Canada, the steady-state voltage limits at the customer's service follow CSA CAN3-C235, the standard for preferred voltage levels, which sets normal and extreme operating ranges. Larchmont's planning limit for the rise caused by a single resource is set well inside the normal range so that existing customers stay within it.
Voltage rise on a radial feeder
Power flowing along a feeder changes the voltage by approximately the current times the impedance, and in per unit that change is well approximated by ΔV ≈ (PR + QX)/V², where P and Q are the real and reactive power flowing toward the substation, R and X are the resistance and reactance of the path, and V is the nominal voltage. A generator that exports real power raises the voltage at its point of connection; one that absorbs reactive power lowers it. On distribution lines R and X are of similar magnitude, so real power has a large effect on voltage, unlike on transmission lines, where X dominates and real power has little effect.
Worked problem
Voltage rise from Birch Hill at 11 km
Birch Hill connects 11 km from the substation on a trunk with R = 0.11 Ω/km and X = 0.40 Ω/km at 24.94 kV. Estimate the voltage rise at the POI when the plant exports 10 MW at unity power factor, and when it absorbs reactive power at a power factor of 0.95.
Show solution
- R = 1.21 Ω and X = 4.40 Ω; V² = (24.94 kV)² = 622 kV².
- \[\Delta V_{pf=1} \approx \dfrac{10 \times 1.21}{622} \approx 0.0195\ \text{pu} = 1.95\ \%\]
- At 0.95 absorbing, Q = −10 tan(acos 0.95) = −3.29 Mvar.
- \[\Delta V \approx \dfrac{10 \times 1.21 - 3.29 \times 4.40}{622} \approx -0.004\ \text{pu}\]
Answer: About 1.95 % at unity power factor, and roughly zero, slightly negative, when the plant absorbs reactive power at 0.95 power factor.
A hosting-capacity screen of feeder F2
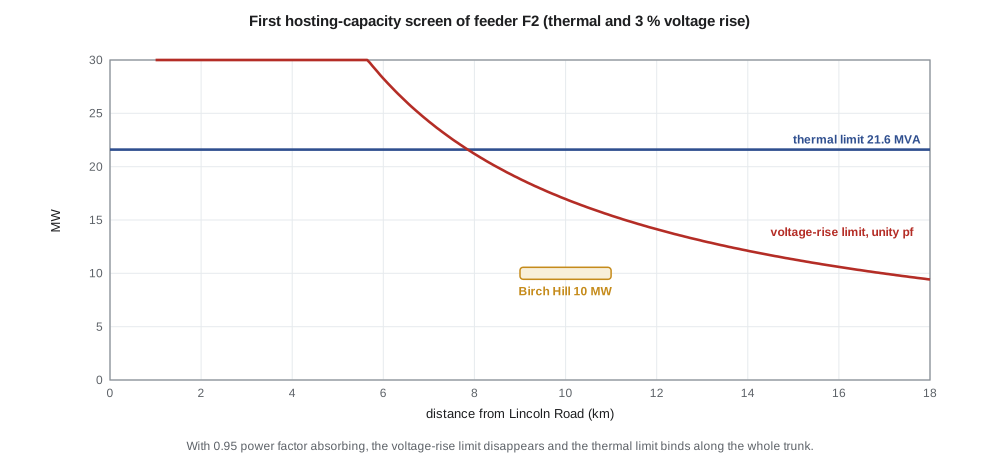
Hosting capacity is the amount of new generation that can connect at a given location without exceeding any planning limit or requiring upgrades. It depends on location, because voltage rise grows with distance from the substation, and on the resource's operating mode, because reactive power absorption offsets voltage rise. Leo builds a first screen of feeder F2's trunk, checking only the thermal limit and the 3 % voltage-rise limit, at unity power factor and at 0.95 absorbing.
import math
# Hosting capacity screen along feeder F2 (Lincoln Road, 25 kV, 18 km)
V = 24.94e3                        # line-to-line voltage, V
R, X = 0.11, 0.40                  # positive-sequence ohm/km, main trunk
AMPACITY = 500.0                   # A, trunk conductor
LIMIT_RISE = 0.03                  # 3 % steady-state voltage rise caused by the DER
def rise(p_mw, q_mvar, km):        # approximate voltage change, per unit: (PR + QX)/V^2
    return (p_mw*1e6*R*km + q_mvar*1e6*X*km)/V**2
print(" km  thermal MVA  rise of 10 MW at pf 1 / 0.95 absorbing   hosting capacity at pf 1 / 0.95 absorbing")
for km in (2, 4, 6, 9, 12, 15, 18):
    thermal = math.sqrt(3)*V*AMPACITY/1e6
    p1 = LIMIT_RISE*V**2/(R*km)/1e6                      # MW at unity pf
    tanphi = math.tan(math.acos(0.95))
    p2 = LIMIT_RISE*V**2/((R - X*tanphi)*km)/1e6 if R - X*tanphi > 0 else float('inf')
    print(f"{km:3d}  {thermal:6.1f}       {rise(10,0,km)*100:5.2f} % / {rise(10,-10*tanphi,km)*100:5.2f} %"
f" {min(p1, thermal):5.1f} MW / {min(p2, thermal):5.1f} MW")km thermal MVA rise of 10 MW at pf 1 / 0.95 absorbing hosting capacity at pf 1 / 0.95 absorbing 2 21.6 0.35 % / -0.07 % 21.6 MW / 21.6 MW 4 21.6 0.71 % / -0.14 % 21.6 MW / 21.6 MW 6 21.6 1.06 % / -0.21 % 21.6 MW / 21.6 MW 9 21.6 1.59 % / -0.31 % 18.8 MW / 21.6 MW 12 21.6 2.12 % / -0.41 % 14.1 MW / 21.6 MW 15 21.6 2.65 % / -0.52 % 11.3 MW / 21.6 MW 18 21.6 3.18 % / -0.62 % 9.4 MW / 21.6 MW
Close to the substation the trunk's ampacity, about 21.6 MVA, is the binding limit. Farther out, voltage rise takes over: at unity power factor the hosting capacity falls to 18.8 MW at 9 km, 14.1 MW at 12 km and 9.4 MW at the end of the feeder. If the plant absorbs reactive power at 0.95, the voltage rise reverses sign and the thermal limit binds everywhere. The screen therefore suggests that Birch Hill's 10 MW, connected around 9 to 11 km out, could pass the voltage criterion even at unity power factor, and comfortably with reactive absorption.
Leo knows the screen is incomplete. It ignores the feeder's existing voltage profile, which at light load may already sit near the upper limit because of the substation's regulation settings; lesson 8 adds it. It ignores protection, which lesson 9 shows may be the real constraint. It ignores the transformer's reverse flow and the 9.9 MW already on F3. And it treats a reactive power setting as free, when absorbing 3.3 Mvar raises the current on the feeder and the losses. Each of those factors shrinks the true hosting capacity.
Hosting capacity maps
Many utilities now publish hosting capacity maps that show, feeder section by feeder section, an estimate of how much generation could connect without upgrades. The estimates come from running power-flow analyses at many locations with the same criteria a study would use: thermal, voltage, protection and sometimes operational flexibility. Some regulators require such maps and require them to be refreshed regularly. Maps help developers choose sites, reduce the number of applications that fail screens and make the utility's assumptions transparent.
Maps have limits too. They describe the system at the time of the analysis, so a map can be out of date as soon as another project connects. They usually assume a particular inverter mode, often unity power factor, and so understate what a project with volt-var control could achieve. And they generally evaluate one project at a time, while the real system receives many. Larchmont's map shows F2's trunk beyond 12 km in yellow, meaning limited capacity, and the area around Birch Hill's site in green, consistent with Leo's screen.
Cost responsibility and alternatives
Under the usual rule that the customer causing an upgrade pays for it, the cost of the solution the study identifies can decide whether a project goes ahead. That gives both the utility and the developer an incentive to look for alternatives. Common options include connecting at a different point or a higher voltage, operating with a different reactive power mode, accepting an export cap enforced by the plant controller, or using a battery to absorb excess output. Lesson 12 compares those options for Birch Hill in money as well as in megawatts.
Common mistakes
MistakeTreating a screen failure as proof that a project cannot connect.
InsteadScreens are conservative; failing one sends a project to a study, not to rejection.
MistakeUsing only the X/R of transmission lines to judge voltage effects on distribution.
InsteadOn feeders R and X are similar, so real power strongly affects voltage.
MistakeReading a hosting capacity map as a guarantee.
InsteadMaps change as projects connect and usually assume a single operating mode.
MistakeStudying voltage rise without the feeder's existing voltage profile.
InsteadThe starting voltage at light load decides how much rise remains available.
Summary and key terms
- Interconnection proceeds through application, screens or studies, an agreement, construction and commissioning.
- Screens such as the 15 %-of-peak-load test quickly pass projects that cannot cause problems.
- System impact studies check thermal, voltage, protection, power quality, equipment and transmission impacts.
- Voltage change on a feeder is approximately (PR + QX)/V²; reactive absorption offsets voltage rise.
- Hosting capacity is bound by thermal limits near the substation and by voltage farther out.
- Hosting capacity maps make limits visible but are snapshots that assume a particular operating mode.
- Customers usually pay for upgrades, which encourages alternatives such as export caps, reactive control and storage.
- Screen
- A quick conservative test that decides whether a project needs a detailed study.
- System impact study
- A study that identifies the problems a project would cause and possible solutions.
- Facilities study
- A study that designs and estimates the cost of the upgrades a project requires.
- Hosting capacity
- The generation that can connect at a location without exceeding limits or needing upgrades.
- Rapid voltage change
- A sudden step in voltage, such as when a generator trips from full output.
- Cluster study
- A study that evaluates a group of queued projects together.
- Export cap
- A limit on the power a facility may deliver at its point of interconnection.
Practice problems
Work each problem on paper first, then reveal the answer to check.
A feeder section peaks at 12 MW. What total generation passes a 15 %-of-peak screen?
Show answer
1.8 MW.
Estimate the voltage rise from 5 MW at unity power factor 15 km out on F2.
Show answer
5 × 1.65/622 ≈ 1.3 %.
Why does absorbing reactive power lower the voltage rise more on feeders than one might expect from transmission experience?
Show answer
Feeder X is large enough relative to R that QX can cancel PR.
At which locations on F2 is the thermal limit, rather than voltage, binding at unity power factor?
Show answer
Within about the first 7 km.
Name two factors Leo's first screen ignored.
Show answer
For example the existing voltage profile and protection impacts.
What did FERC Order 2023 change about transmission queues?
Show answer
It moved to cluster studies with readiness requirements and deadlines.
Lesson quiz · 5 questions
Score 60% or more to complete this lesson.
Create a free account to save your progress, take quizzes and earn a certificate.