
CRE-202 · Lesson 11 of 12 · 29 min
Reporting to brands and media kits
Brand partnerships depend on trust in numbers. Before a campaign, brands want evidence that a creator's audience matches their target market and that content performs reliably; after a campaign, they want proof of what it delivered. Clear, honest reporting helps creators win partnerships, justify rates and build long-term relationships. Misleading or inflated reporting damages reputations and can breach contracts and advertising rules. This lesson covers what brands want to know, building a media kit, choosing and presenting metrics, typical performance versus best results, screenshots and verified data, campaign reports, benchmarks and context, presenting qualitative results, reporting templates and honesty. CRE-310 covers negotiation and pricing.
What brands want to know
Brands and agencies evaluating creators typically ask:
- Who is the audience? Age, gender, location, language and interests, compared with the brand's target customers.
- How many people will see sponsored content? Typical reach or views per post or video, by format and platform.
- How engaged is the audience? Engagement rates, comments, saves, shares and the quality of community interaction.
- Will it drive action? Past results on clicks, codes, sign-ups and sales, where available.
- Is the creator a good fit? Content style, values, brand safety and past partnerships.
- Is the data genuine? Signs of authentic audiences rather than inflated numbers.
Many brands use influencer marketing platforms that access creator data directly through platform interfaces, with the creator's permission, or estimate data from public information. Providing accurate first-party data, from the platforms' own analytics, builds credibility.
Building a media kit
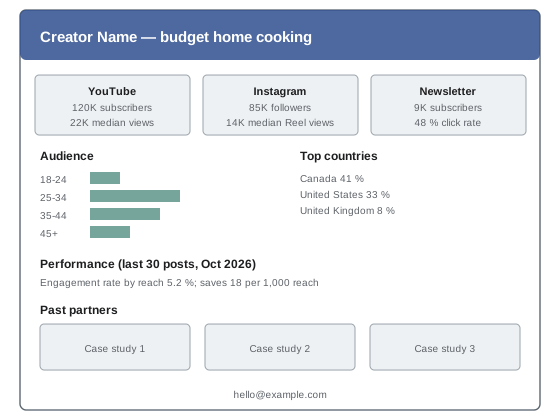
A media kit is a short document, often one to three pages or a simple web page, that introduces a creator to potential partners. Typical contents include:
- A brief introduction: who you are, what you make, your niche and values.
- Platforms and audience size: followers or subscribers on each platform, with dates.
- Performance: typical views or reach per post by format, engagement rates with stated definitions, and watch time or retention for video.
- Audience: demographics, top countries and cities, and any relevant interests.
- Past partnerships: logos or names of brands (with permission) and short case studies with results.
- Offerings: types of content and packages available, such as integrations, dedicated videos, stories or usage rights, often with indicative rates or a note that rates are provided on request.
- Contact information.
Update media kits regularly, at least quarterly, with dates on all figures, since outdated numbers mislead.
Choosing and presenting metrics
Present metrics that are relevant to the brand's goals and defined clearly:
- For awareness campaigns: typical reach and views, audience demographics and frequency.
- For consideration: engagement, saves, shares, comments and watch time.
- For conversion: link clicks, discount code uses, sign-ups and sales from past campaigns.
State definitions and periods: "median views per Reel in the first 7 days, last 30 Reels, measured October 2026" is far more useful than "average views 25K". State the denominator for engagement rates. Separate platforms and formats, since a creator's short-form views and long-form views are not interchangeable. If figures are rounded, say so.
Typical performance versus best results
Brands increasingly ask for typical, rather than best, performance, because they will pay for an average post, not the creator's best-ever viral hit. Reporting median views per post over a recent period, with the typical range, gives a reliable expectation. Mentioning top-performing content is fine, clearly labelled, but leading with the highest number creates expectations that ordinary campaign posts will not meet, damaging relationships. Including the performance of past sponsored posts, which often differs from organic posts, is particularly useful and honest.
Worked problem
Presenting typical performance
A creator's last 30 YouTube videos had 7-day views ranging from 9,000 to 410,000, with a median of 22,000 and an interquartile range of 15,000 to 34,000. The mean is 48,000 because of two viral videos. Their last four sponsored videos had a median of 19,000 views. What should the media kit say?
Show solution
- Lead with the median: "Typical 7-day views: 22,000 (middle half 15,000–34,000), last 30 videos."
- Report sponsored performance: "Sponsored videos: median 19,000 views at 7 days (last 4)."
- Mention viral reach separately: "Top videos have reached up to 410,000 views."
- Avoid presenting the mean of 48,000 as typical.
Answer: Lead with the 22,000 median and its range, report sponsored medians, and label viral results as top performance, not typical.
Screenshots and verified data
Brands often ask for screenshots of analytics dashboards, especially audience demographics and post performance, because numbers typed into a document can be edited. Provide screenshots that show the date range, metric names and account identity. Some influencer platforms connect directly to a creator's accounts with permission and pull verified data, which many brands prefer. Never edit screenshots; altering analytics evidence is dishonest and may be fraud. If data must be shared securely, use the platform's official sharing tools or read-only access rather than passwords.
Campaign reports
After a campaign, a report summarizes what was delivered and achieved. A good campaign report includes:
- The deliverables: each post or video, with links, publication dates and formats.
- Exposure: views, reach and impressions at agreed windows, such as 7 and 30 days.
- Engagement: likes, comments, shares, saves, engagement rate with stated denominator, and notable comments.
- Action: link clicks, code uses, sign-ups or sales, from the creator's or brand's tracking.
- Audience: demographics of viewers of the sponsored content, if available.
- Comparison: performance relative to the creator's typical content and to the campaign's goals.
- Insights and recommendations: what worked, what to try next time.
Agree before the campaign which metrics will be reported, at which windows, and who will provide which data, since brands often track conversions on their own systems.
| Report section | Example content |
|---|---|
| Deliverables | 1 integrated YouTube video, 3 Instagram stories, 1 Reel |
| Exposure (30 days) | Video 41,200 views; Reel 63,500 views, 48,900 reach |
| Engagement | Reel: 4.8 % engagement by reach; 310 saves; 120 shares |
| Action | 1,940 link clicks; 212 code uses |
| Effective CPM | $2,500 fee ÷ 104,700 views × 1,000 ≈ $23.9 |
| Insights | Demo in first 20 seconds drove most clicks; recommend repeating in Q1 |
Benchmarks and context
Numbers mean more with context. Comparing sponsored content with the creator's own typical content shows whether the integration performed well. Comparing cost per view or per click with the brand's other channels, where the brand shares them, shows value. External benchmarks, such as average engagement rates for a platform or niche, can help, with caution about their methods (Lesson 3). Explaining unusual factors, such as a platform outage, a definition change or a holiday period, helps brands interpret results fairly.
Presenting qualitative results
Not all value appears in numbers. Comments asking where to buy, messages from viewers who tried the product, user-generated content, brand mentions by viewers and positive sentiment are meaningful evidence of influence. Selecting representative comments, with permission where appropriate and without misrepresenting overall sentiment, adds depth to reports. Negative feedback should not be hidden: brands value honest insight into how audiences responded, and addressing concerns builds trust.
Honesty and compliance
Inflating numbers, presenting unrepresentative results, hiding poor performance, using bought followers or engagement, or editing screenshots can lead to lost partnerships, contract disputes and legal consequences. Sponsored content must also be disclosed clearly to audiences under advertising rules (CRE-320), and campaign reports should confirm that disclosures were made. Honest reporting, including honest discussion of results that fell short and what might improve them, builds the long-term relationships that sustain creator businesses.
Rate cards and pricing evidence
Many creators include a rate card in their media kit or provide one on request, listing prices for common deliverables such as an integrated mention, a dedicated video, a Reel, a story set or usage rights. Analytics support pricing: typical views per format, engagement rates and past campaign results justify rates, and effective CPM calculations allow comparison with other advertising options. Rates commonly vary with exclusivity, usage rights, timelines and the amount of production involved. CRE-310 covers pricing strategy; the analytics lesson is that rates should be grounded in typical, recent and honest performance data.
Worked problem
Pricing from typical views
A creator's typical integrated YouTube sponsorship receives 25,000 views in 30 days. Brands in the niche commonly pay an effective CPM of $20 to $35 for similar integrations. What fee range is reasonable?
Show solution
- Low end: 25,000 ÷ 1,000 × $20 = $500.
- High end: 25,000 ÷ 1,000 × $35 = $875.
- Adjust for usage rights, exclusivity, production work and past conversion results.
Answer: About $500 to $875 before adjustments for rights, exclusivity and extra production.
Reporting cadence and long-term relationships
For ongoing partnerships, regular reports, such as monthly or after each deliverable, keep brands informed and build trust. A short summary with key metrics, comparisons with previous deliverables and suggestions for improvement is more useful than a long data dump. Over time, a history of reports demonstrates reliability and supports renewals, rate increases and deeper collaborations such as ambassador programmes. Keeping copies of all reports, contracts and data in an organized folder protects both parties if questions arise later.
Working with agencies and platforms
Brands often work through agencies or influencer marketing platforms, which may have their own reporting templates, verification requirements and data access tools. Understanding their requirements in advance, such as the specific metrics, screenshot formats or API connections they need, makes reporting smoother. Some platforms offer branded content tools that share performance data directly with partners, such as Instagram's branded content tags and partnership ads, and YouTube's paid promotion and BrandConnect programme. Using these tools correctly also helps ensure proper disclosure.
Interpreting campaign results fairly
Not every campaign succeeds, and many factors are outside the creator's control: product appeal, price, timing, competition and the brand's own landing pages. A fair report separates what the creator delivered, such as views, engagement and clicks, from what happened after the click, such as conversion on the brand's website. When results disappoint, analysing where in the funnel people dropped off helps both sides improve the next campaign.
Presenting audience fit
Brands want to know whether a creator's audience matches their customers. A useful presentation compares the brand's target, such as "women aged 25–44 in Canada and the United States interested in home cooking", with the creator's audience data: age and gender bands, top countries and interest indicators. Showing the percentage of the audience within the target, for example "62 % of viewers are 25–44; 71 % are in Canada or the US", is clearer than listing every demographic. Where the fit is partial, explain which segments align best and suggest formats that reach them.
Worked problem
Estimating target audience reach
A creator's typical Reel reaches 50,000 accounts. Audience data show that 60 % of viewers are aged 25–44 and 70 % are in Canada or the US. Assuming these proportions are independent, how many accounts in the brand's target (25–44 in Canada or the US) does a typical Reel reach?
Show solution
- Share in both groups: 0.60 × 0.70 = 0.42.
- Target reach: 50,000 × 0.42 = 21,000 accounts.
- Note the independence assumption; actual overlap may differ.
Answer: About 21,000 target accounts per typical Reel, with a note on the assumption.
Case studies in media kits
Short case studies of past partnerships, with the brand's permission, are among the most persuasive parts of a media kit. Each might describe the brand's goal, the content created, key results such as views, engagement, clicks and code uses, and a quote from the brand. Choosing representative rather than exceptional campaigns, or including both, keeps expectations realistic.
Common reporting pitfalls
Typical pitfalls in reports to brands include mixing platforms in a single total without explanation, reporting lifetime figures for some posts and 7-day figures for others, using follower-based engagement rates for viral posts without noting the denominator, omitting stories or other deliverables that performed poorly, and failing to note when data are provisional. Each of these can lead to misunderstandings. A short methods note at the end of each report, explaining definitions, windows, data sources and any limitations, prevents most of them and signals professionalism.
Common mistakes
MistakeLeading with viral best-ever numbers.
InsteadLead with medians and typical ranges.
MistakeUndated and undefined metrics.
InsteadState definitions, windows and dates.
MistakeEditing analytics screenshots.
InsteadShare genuine screenshots or verified access.
MistakeReporting only exposure.
InsteadInclude engagement, action and insights.
MistakeHiding poor results.
InsteadExplain them honestly and recommend improvements.
Summary and key terms
- Brands want audience fit, typical reach, engagement, action and authenticity.
- Media kits introduce creators with dated, defined metrics.
- Choose metrics matching awareness, consideration or conversion goals.
- Report typical performance, including past sponsored content.
- Provide genuine screenshots or verified data access.
- Campaign reports cover deliverables, exposure, engagement, action and insights.
- Context, qualitative evidence and honesty build long-term partnerships.
- Media kit
- Document introducing a creator to partners.
- Rate card
- List of prices for content packages.
- First-party data
- Data from the platforms' own analytics.
- Awareness
- Campaign goal of reaching people.
- Consideration
- Campaign goal of engaging interest.
- Conversion
- Campaign goal of driving action.
- Campaign report
- Summary of what a campaign delivered.
- Deliverables
- Agreed pieces of content.
- Usage rights
- Brand permission to reuse creator content.
- Brand safety
- Suitability of content for brand association.
Practice problems
Work each problem on paper first, then reveal the answer to check.
Name four things brands want to know.
Show answer
Audience, typical reach, engagement, action, fit, authenticity.
Name five media kit sections.
Show answer
Intro, platforms, performance, audience, partnerships, offerings, contact.
Which metrics suit awareness campaigns?
Show answer
Reach, views, demographics, frequency.
Why report medians to brands?
Show answer
They describe typical posts the brand will receive.
Why include past sponsored performance?
Show answer
It often differs from organic posts.
What should screenshots show?
Show answer
Date range, metric names and account identity.
Effective CPM for $1,800 and 60,000 views?
Show answer
$30.
What should be agreed before a campaign?
Show answer
Metrics, windows and who provides which data.
Name a qualitative result.
Show answer
Comments asking where to buy, viewer messages, UGC.
Why report poor results honestly?
Show answer
It builds trust and long-term relationships.
Lesson quiz · 5 questions
Score 60% or more to complete this lesson.
Create a free account to save your progress, take quizzes and earn a certificate.