
CMP-340 · Lesson 4 of 12 · 32 min
Estimation and planning
'When will it be done?' is the question every software team is asked and the one it answers worst. Studies of software projects have found again and again that initial estimates are optimistic, often by a wide margin, and that large projects overrun more than small ones. Part of the problem is psychological: people underestimate tasks they have not done before and forget the work around the work, such as reviews, meetings, testing and deployment. Part is structural: early in a project the requirements and design are uncertain, so any single number is a guess. This lesson treats estimation honestly, as forecasting under uncertainty. It covers why estimates go wrong, the cone of uncertainty, expert and group techniques such as three-point estimates and planning poker, relative sizing with story points and velocity, probabilistic forecasting with Monte Carlo simulation, parametric models such as COCOMO II, and how to turn estimates into release plans. CON-300 covered cost estimation for construction and PMP-130 covers schedule development for the PMP; the ideas overlap, but software has its own characteristic uncertainties.
Why estimates go wrong
An estimate, a target and a commitment are three different things, and confusing them causes much of the trouble. An estimate is a prediction of how long something will take, with some uncertainty. A target is a desired date, often set by business needs. A commitment is a promise to deliver a defined scope by a date. Steve McConnell's advice is that when a target and an estimate disagree, the honest response is to change the scope, the date or the resources, not to change the estimate until it matches the target. A team that 'estimates' to fit the target has stopped estimating.
Other common sources of error include planning only for the happy path, forgetting non-coding work, assuming full-time availability when people also handle support and meetings, anchoring on a number someone mentioned early, and the planning fallacy described by psychologists Daniel Kahneman and Amos Tversky: people predict their own tasks from an imagined best case rather than from how long similar tasks actually took. The best single correction is to use historical data. If the last five similar features each took 40 to 60 per cent longer than estimated, the next one probably will too.
| Term | Meaning | Example |
|---|---|---|
| Estimate | A prediction with uncertainty | "Probably 6 to 9 weeks, most likely 7" |
| Target | A desired outcome | "We would like to launch before the grant deadline" |
| Commitment | A promise of scope by a date | "We will deliver sign-up and reminders by 1 March" |
The cone of uncertainty
Barry Boehm observed, and Steve McConnell later popularized as the cone of uncertainty, that the range of possible outcomes is widest at the start of a project and narrows as decisions are made. At the initial concept stage, the eventual effort may plausibly be anywhere from a quarter to four times the estimate. After requirements are agreed, the range narrows to perhaps two-thirds to one and a half times; after detailed design, to within about 25 per cent. The cone does not narrow by itself: it narrows only because the team makes decisions that remove uncertainty, such as settling requirements and building the risky parts first.
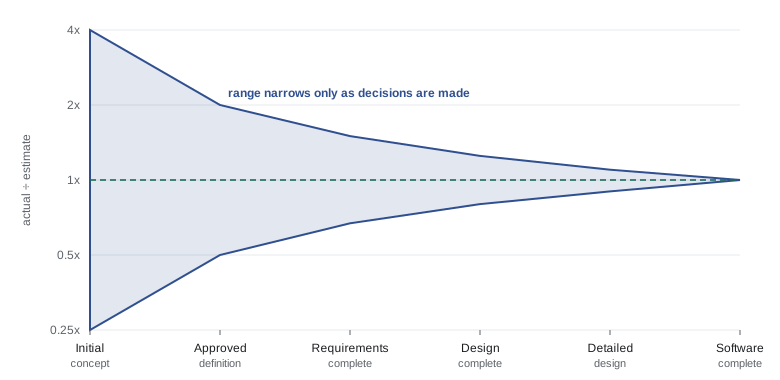
The practical consequence is to give early estimates as ranges, to re-estimate at milestones, and to be wary of fixed-price commitments made at the concept stage. Agile planning embraces this: it commits to near-term work in detail and treats later work as a forecast that is revised every sprint.
Expert and group techniques
Most software estimates are expert judgements. Two techniques make them better. The first is decomposition: break the work into tasks small enough to compare with things the team has done before, estimate each, and add them. Errors in small estimates partly cancel out, and decomposition exposes forgotten work. The second is to ask for ranges rather than single numbers. In the three-point or PERT technique, each task gets an optimistic estimate \(O\), a most likely estimate \(M\) and a pessimistic estimate \(P\). The expected value and standard deviation are approximated as
For a project of independent tasks, expected values add and variances add, so the project's standard deviation is the square root of the sum of the task variances. This gives a total with a range, for example 'about 41 days, and 90 per cent likely to be under 47 days'. The formulas come from the beta distribution used in the PERT method of the 1950s; they are approximations, and real tasks are often correlated (if one goes badly because the library is poor, others may too), so the true range is usually wider.
import math

tasks = [   # (task, optimistic, most likely, pessimistic) in person-days
    ("Shift data model and migrations", 2, 3, 6),
    ("Sign-up flow and validation",      3, 5, 10),
    ("Email and text reminders",         2, 4, 9),
    ("Monthly hours report",             2, 3, 5),
    ("Accessibility review and fixes",   2, 3, 7),
    ("Deployment pipeline",              1, 2, 5),
]
total_e, total_var = 0.0, 0.0
for name, o, m, p in tasks:
    e, sd = (o + 4 * m + p) / 6, (p - o) / 6
    total_e += e
    total_var += sd ** 2
    print(f"{name:34s} E = {e:4.1f}  sd = {sd:3.1f}")
sd = math.sqrt(total_var)
print(f"project: E = {total_e:.1f} days, sd = {sd:.1f}")
print(f"about 90% likely under {total_e + 1.28 * sd:.1f} days (if tasks are independent)")
print("sum of most-likely values:", sum(m for _, _, m, _ in tasks), "days")Shift data model and migrations E = 3.3 sd = 0.7 Sign-up flow and validation E = 5.5 sd = 1.2 Email and text reminders E = 4.5 sd = 1.2 Monthly hours report E = 3.2 sd = 0.5 Accessibility review and fixes E = 3.5 sd = 0.8 Deployment pipeline E = 2.3 sd = 0.7 project: E = 22.3 days, sd = 2.1 about 90% likely under 25.1 days (if tasks are independent) sum of most-likely values: 20 days
Look at the last line: the sum of the most-likely values is smaller than the expected total, because task durations are skewed. A task can finish only a little early but can run very late. Planning from most-likely values therefore builds in an overrun.
Wideband Delphi and planning poker bring several people into the estimate. In planning poker, popularized by Mike Cohn, each team member privately chooses a card with an estimate, everyone reveals at once, and the people with the highest and lowest estimates explain their reasoning before the team estimates again. The simultaneous reveal prevents anchoring on the first speaker, and the discussion surfaces assumptions: the person who estimated high often knows about a complication the others missed. Cards usually use a modified Fibonacci sequence (1, 2, 3, 5, 8, 13, 20, 40, 100) because the gaps between large numbers reflect how much less precisely large items can be estimated.
Story points and velocity
Many agile teams estimate in story points, a relative measure of size that combines effort, complexity and uncertainty. The team picks a reference story, perhaps a simple form worth 2 points, and sizes others relative to it: about twice as much is 5, much bigger is 13. Points are deliberately not hours. People are much better at comparing tasks than at predicting absolute durations, and relative sizes stay stable even as the team gets faster.
Velocity is the number of points a team completes per sprint, counting only stories that meet the definition of done. After a few sprints, velocity turns points into time: a 120-point release at a velocity of about 24 per sprint will take about 5 sprints. Velocity is a planning tool for one team, not a performance measure. Comparing velocities between teams is meaningless because each team has its own scale, and using velocity as a target invites point inflation, which destroys its value for planning. This is an instance of Goodhart's law: when a measure becomes a target, it ceases to be a good measure.
Probabilistic forecasting with Monte Carlo
A single average velocity gives a single date, but velocity varies from sprint to sprint. Monte Carlo simulation turns that variation into a forecast with probabilities. Take the team's recent velocities, simulate many possible futures by repeatedly sampling a velocity for each future sprint until the backlog is finished, and count how often each number of sprints occurs. The result is a statement such as 'about 50 per cent likely within 6 sprints, almost certain within 7'. This is more honest than a single date, and it uses only data the team already has. Teams using Kanban do the same with weekly throughput counts.
import random
from collections import Counter

random.seed(301)
history = [21, 26, 18, 24, 30, 19, 23, 25]     # velocity of the last 8 sprints
backlog = 140                                  # points left in the release

def sprints_needed():
    done, n = 0, 0
    while done < backlog:
        done += random.choice(history)          # resample from past performance
        n += 1
    return n

runs = [sprints_needed() for _ in range(10000)]
counts = Counter(runs)
cumulative = 0
print("sprints  probability  cumulative")
for n in sorted(counts):
    cumulative += counts[n]
    print(f"{n:7d}  {counts[n] / len(runs):11.1%}  {cumulative / len(runs):10.1%}")
avg = sum(history) / len(history)
print(f"single-number estimate from average velocity {avg:.1f}: {backlog / avg:.1f} sprints")sprints probability cumulative
5 0.2% 0.2%
6 48.5% 48.7%
7 50.8% 99.5%
8 0.5% 100.0%
single-number estimate from average velocity 23.2: 6.0 sprints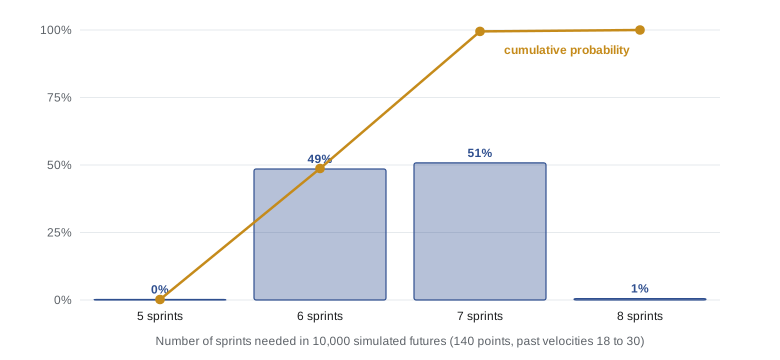
Worked problem
Answering "when will it be done?"
A product owner asks whether the 140-point release can ship within 6 sprints for a funding announcement. Using the simulation above, what should the team say, and what options can it offer?
Show solution
- Read the cumulative column: finishing within 6 sprints has a probability of just under 50 per cent, while finishing within 7 is almost certain (over 99 per cent of simulated futures).
- State the forecast plainly: "Six sprints is close to a coin flip; seven is very likely."
- Offer options rather than a yes or no: reduce scope so the remaining backlog fits 6 sprints with high confidence (re-run the simulation with the smaller backlog), move the announcement to after sprint 7, or announce the features most likely to be ready.
- Agree to re-forecast after each sprint, when the remaining backlog and velocity history are updated.
Answer: Give a probability, not a promise, and turn the conversation toward scope and date trade-offs. Re-forecasting every sprint narrows the uncertainty as the release approaches.
Parametric models: COCOMO II
Parametric models estimate effort from measurable characteristics of the project. The best known is the Constructive Cost Model, COCOMO, published by Barry Boehm in 1981 and revised as COCOMO II in 2000. Its post-architecture model estimates effort in person-months as
where Size is in thousands of source lines of code (KSLOC), \(A = 2.94\) and \(B = 0.91\) are calibration constants, the \(SF_j\) are five scale factors (precedentedness, development flexibility, architecture and risk resolution, team cohesion and process maturity), and the \(EM_i\) are effort multipliers for things such as required reliability, product complexity, team capability and tool use. With nominal scale factors, \(E\) is about 1.10, so effort grows faster than size: doubling the code more than doubles the effort, a diseconomy of scale that reflects growing communication and integration costs. The schedule estimate is roughly \(3.67 \times PM^{0.28 + 0.2(E - 0.91)}\) months.
# COCOMO II post-architecture estimate with nominal scale factors and multipliers
A, B = 2.94, 0.91
nominal_sf = [3.72, 3.04, 4.24, 3.29, 4.68]    # PREC, FLEX, RESL, TEAM, PMAT (nominal)
E = B + 0.01 * sum(nominal_sf)

def cocomo(ksloc, em=1.0):
    pm = A * ksloc ** E * em
    months = 3.67 * pm ** (0.28 + 0.2 * (E - B))
    return pm, months

print(f"exponent E = {E:.3f}")
for size in (10, 20, 40):
    pm, months = cocomo(size)
    print(f"{size:3d} KSLOC: {pm:6.1f} person-months over {months:4.1f} months, "
          f"average team {pm / months:4.1f}")
pm_hi, _ = cocomo(20, em=1.26)                # e.g. high required reliability
print(f"20 KSLOC with high reliability (x1.26): {pm_hi:.1f} person-months")exponent E = 1.100 10 KSLOC: 37.0 person-months over 11.6 months, average team 3.2 20 KSLOC: 79.3 person-months over 14.7 months, average team 5.4 40 KSLOC: 169.9 person-months over 18.8 months, average team 9.0 20 KSLOC with high reliability (x1.26): 99.9 person-months
COCOMO's weakness is that it needs the size in lines of code, which is unknown early, and its constants must be calibrated with an organization's own data to be accurate. Function point analysis measures size instead by counting inputs, outputs, inquiries, files and interfaces from the requirements, and is used in contract work and benchmarking. For small agile teams, parametric models are most useful as a sanity check on expert and velocity-based estimates, and for teaching the important lesson that effort does not scale linearly with size.
From estimates to release plans
A release plan maps the prioritized backlog onto future sprints using a forecast of velocity, showing which features are likely in which release. Good release plans have several properties. They are ordered by value and risk, so that if time runs out, what is missing matters least. They include buffers, either as explicit contingency or by planning to a conservative forecast such as the 85th percentile. They separate the fixed from the flexible: in agile contracts it is common to fix time and cost and let scope vary, while fixed-scope contracts must carry larger contingencies. And they are revisited every sprint.
# Release plan: fill sprints from the ordered backlog at a conservative velocity
backlog = [("Sign up for a shift", 13), ("Volunteer accounts", 8), ("Reminder emails", 5),
           ("Coordinator roster view", 8), ("Monthly hours report", 8), ("Waiting list", 5),
           ("Text reminders", 5), ("Parent consent for minors", 8), ("Swap shifts", 13),
           ("Single sign-on", 13)]
velocity = 20          # conservative forecast (roughly the 25th percentile of history)
sprint, used, plan = 1, 0, {}
for story, pts in backlog:
    if used + pts > velocity:
        sprint, used = sprint + 1, 0
    plan.setdefault(sprint, []).append(story)
    used += pts
for s, stories in plan.items():
print(f"Sprint {s}: " + ", ".join(stories))Sprint 1: Sign up for a shift Sprint 2: Volunteer accounts, Reminder emails Sprint 3: Coordinator roster view, Monthly hours report Sprint 4: Waiting list, Text reminders, Parent consent for minors Sprint 5: Swap shifts Sprint 6: Single sign-on
The simple rule keeps the backlog order strictly, so sprint 1 holds only the 13-point sign-up story and has 7 points of slack. A real team would pull a small, independent item forward to use that capacity, or split the large story, which is exactly the kind of judgement a release plan supports rather than replaces. The plan also shows the product owner something useful at a glance: single sign-on, the lowest-value item, is the one most likely to slip, which is what ordering by value is meant to achieve.
Risk management belongs in the plan too. A risk register lists what might go wrong, its probability and impact, and the response: avoid, reduce, transfer or accept. For software, common risks include unfamiliar technology, dependence on another team or vendor, unclear requirements in one area, key-person dependency, and performance or security unknowns. The spiral model's lesson from lesson 2 applies: schedule the riskiest items early, while there is still time to change course.
Worked problem
Sizing with planning poker
The team estimates "send text reminders 2 hours before each shift". The reference story "reminder emails" is 3 points. Cards revealed: 3, 3, 5, 13, 3. What happens next?
Show solution
- The outlier who chose 13 and one person who chose 3 explain their reasoning.
- The 13 voter points out that text messages need a paid provider, an account, handling of opt-outs as required by anti-spam and telecom rules, and failure handling when numbers are invalid.
- The team agrees that part is real work nobody else considered, and re-votes: 8, 8, 5, 8, 8.
- The team records 8 points and adds a note about the provider integration and consent requirements.
Answer: The outlier's explanation surfaced hidden work. Planning poker's value is less the number than the conversation it forces.
Common mistakes
MistakeChanging an estimate to match a desired date.
InsteadKeep the estimate honest and negotiate scope, date or resources instead.
MistakeGiving a single number early in a project.
InsteadEarly estimates belong in ranges reflecting the cone of uncertainty, refined at milestones.
MistakePlanning from most-likely task durations.
InsteadDurations are skewed late; use expected values or probabilistic forecasts, and include non-coding work.
MistakeComparing velocity between teams or setting velocity targets.
InsteadPoints are team-relative; using velocity as a target causes inflation and ruins it for forecasting.
MistakeForgetting risk when planning.
InsteadKeep a risk register and schedule the riskiest items early, while there is time to respond.
Summary and key terms
- Estimates, targets and commitments differ; when an estimate and a target conflict, negotiate scope, date or resources rather than the estimate.
- The cone of uncertainty means early estimates can be off by a factor of four either way; uncertainty narrows only as decisions are made.
- Decomposition and three-point estimates, with E = (O + 4M + P)/6, produce totals with ranges; most-likely sums understate effort.
- Planning poker combines independent estimates and discussion of outliers, avoiding anchoring and surfacing hidden work.
- Story points measure relative size; velocity converts points to sprints for one team and must not become a target.
- Monte Carlo simulation of past velocities or throughput produces forecasts with probabilities.
- COCOMO II estimates effort from size with an exponent above 1, showing diseconomies of scale; release plans order work by value and risk and include buffers.
- Estimate
- A prediction of effort or duration, with uncertainty.
- Cone of uncertainty
- The narrowing range of plausible outcomes as a project progresses and decisions are made.
- Three-point estimate
- An estimate from optimistic, most likely and pessimistic values.
- Planning poker
- A consensus estimation technique with simultaneous reveal and discussion of outliers.
- Story point
- A relative unit of size combining effort, complexity and uncertainty.
- Velocity
- Story points of done work completed per sprint by a team.
- Monte Carlo simulation
- Estimating outcome probabilities by repeated random sampling.
- COCOMO II
- A parametric effort model based on size, scale factors and effort multipliers.
- Release plan
- A forecast of which backlog items will be delivered in which future sprints or releases.
- Risk register
- A list of risks with probability, impact and planned response.
Practice problems
Work each problem on paper first, then reveal the answer to check.
A task has O = 2, M = 4, P = 12 days. Find E and sigma.
Show answer
E = (2 + 16 + 12)/6 = 5 days; sigma = (12 - 2)/6 = 1.67 days.
Why is E larger than M in the previous question?
Show answer
The distribution is skewed: the pessimistic case is much further from M than the optimistic case.
A manager says the release must ship in 4 sprints; the forecast says 6. List three honest responses.
Show answer
Reduce scope to what fits 4 sprints; move the date; add capacity early to separable work (with Brooks's law in mind).
Why do planning poker cards use 1, 2, 3, 5, 8, 13, 20 rather than every number?
Show answer
Larger items are estimated less precisely, so wider gaps reflect real uncertainty and stop false-precision debates.
A team's velocity was 18, 22, 20. How many sprints for 100 points by average velocity?
Show answer
Average 20, so 5 sprints, though a Monte Carlo forecast would give a range.
Explain Goodhart's law using velocity.
Show answer
If velocity becomes a target, teams inflate points, so velocity no longer measures output and loses its value for forecasting.
In COCOMO II, what does an exponent E above 1 imply?
Show answer
A diseconomy of scale: effort grows faster than size.
At the initial concept stage, a project is estimated at 10 person-months. What range does the cone of uncertainty suggest?
Show answer
Roughly 2.5 to 40 person-months (a quarter to four times).
Name three non-coding activities often missing from estimates.
Show answer
Code review, testing and test maintenance, deployment, meetings, documentation, support interruptions.
Give a risk for a volunteer app and a response of each type: avoid, reduce, accept.
Show answer
Risk: the text-message provider is unreliable. Avoid: use email only for the first release. Reduce: integrate early with a fallback provider. Accept: proceed and monitor.
Lesson quiz · 5 questions
Score 60% or more to complete this lesson.
Create a free account to save your progress, take quizzes and earn a certificate.