
CIV-470 · Lesson 3 of 12 · 20 min
Dams, spillways and reservoir sedimentation
Storage is only as good as the structure that holds it. The Kestrel Lake dam is a 7 m high earth embankment about 140 m long, with a concrete overflow spillway 8 m wide at one abutment and a low-level outlet through the embankment. It was built in 1958 for a pulp company's camp, passed to the municipality in the 1980s, and has never had a full dam safety review. The master plan must answer three questions: how serious would a failure be, how large a flood must the dam pass safely, and how fast is the lake filling with sediment?
Types of dams
Embankment dams are built of earth or rockfill and are by far the most common type, because they use local materials and suit most foundations. An earthfill dam relies on a zone of low-permeability soil, a core or a homogeneous section, to hold water, with filters and drains to control seepage; a rockfill dam uses a central clay core or an upstream membrane of concrete or asphalt. Concrete gravity dams resist the water by their weight and need a rock foundation; arch dams carry the load into the valley walls; buttress dams use a sloping slab supported on ribs. The type follows the site: the valley shape, the foundation, the materials and the spillway arrangement.
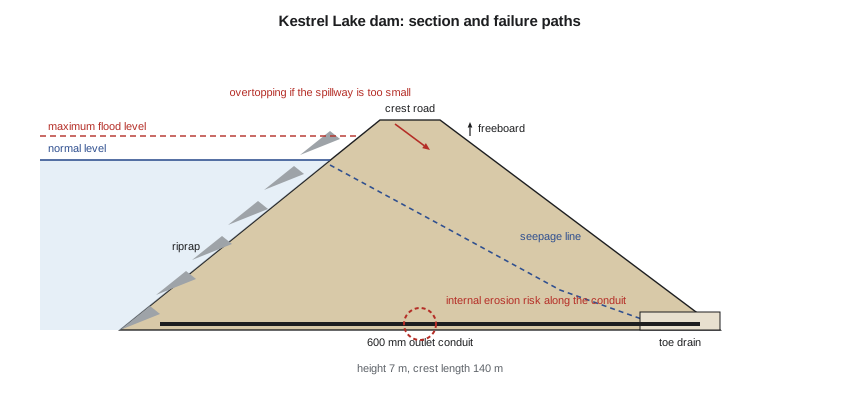
The Kestrel Lake dam is a homogeneous embankment of the silty sand and till found nearby, with a riprap facing on the upstream slope, a grassed downstream slope and, according to the 1958 drawings, a toe drain of gravel. The low-level outlet is a 600 mm concrete pipe with a gate at the upstream end.
How dams fail
Embankment dams fail mainly by overtopping, by internal erosion and by slope or foundation instability. Overtopping occurs when the spillway cannot pass a flood; water flowing over an earth crest erodes it quickly, cuts a breach and releases the reservoir. Internal erosion, often called piping, occurs when seepage carries soil particles out of the embankment or foundation, enlarging a pipe that eventually collapses the dam; it is especially likely along conduits through the embankment, at contacts with concrete and where filters are missing. Instability occurs when slopes slide under high pore pressure, after rapid drawdown of the reservoir or during an earthquake. Internationally, overtopping and internal erosion together account for most embankment failures.
Inspection of Kestrel Lake dam in the spring found a wet area on the downstream slope near the outlet pipe and minor erosion of the upstream riprap. Dr. Lena Kowalczyk recommends piezometers on either side of the conduit and a filter diaphragm around it if the conduit is replaced. Those geotechnical measures belong to the dam safety review; this lesson concentrates on the hydrologic and hydraulic adequacy of the spillway.
Consequence classification and the inflow design flood
Dam safety practice in Canada rests on the Canadian Dam Association's Dam Safety Guidelines, first issued in 2007 and revised in 2013, together with provincial law. In Ontario, the Lakes and Rivers Improvement Act and the province's technical bulletins set the requirements for dams. The guidelines classify a dam by the consequences of its failure, considering the population at risk, loss of life, environmental and cultural values, and infrastructure and economic losses, into classes from low to extreme. The inflow design flood, the flood the dam must pass safely, rises with the class: from the 1-in-100-year flood for a low-consequence dam, through events between 1-in-100 and 1-in-1,000 for a significant one, to fractions of the way between the 1-in-1,000-year flood and the probable maximum flood (PMF) for high and very high consequence dams, and the full PMF for an extreme one.
A dam-break study shows that a breach of Kestrel Lake dam would send a flood wave down the creek that would reach the operations centre's yard, overtop Ridgeway Road and flood several houses on the lower creek. With a population at risk and a major road, the team rates the dam as high consequence. The inflow design flood is then one third of the way between the 1-in-1,000-year flood and the PMF.
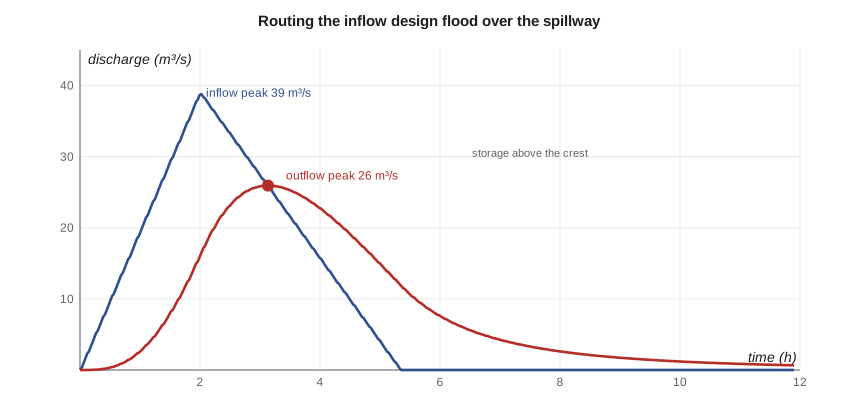
The probable maximum flood is the flood from the probable maximum precipitation, the greatest depth of rain physically possible over the basin for a given duration, combined with the most severe reasonable snowmelt and watershed conditions. It is estimated by storm maximization and transposition of large observed storms, and then routed through a watershed model. For the 3.1 km² drainage area of Kestrel Lake, the team's hydrologist estimates a PMF peak inflow of about 70 m³/s, against 24 m³/s for the 1-in-1,000-year flood. One third of the way between them is about 39 m³/s.
| Consequence | Typical inflow design flood (CDA 2013) | Kestrel Lake |
|---|---|---|
| Low | 1-in-100-year flood | |
| Significant | between 1-in-100 and 1-in-1,000 | |
| High | 1/3 between 1-in-1,000 and the PMF | adopted |
| Very high | 2/3 between 1-in-1,000 and the PMF | |
| Extreme | PMF | tested |
Spillways and flood routing
The spillway carries floods past the dam. Overflow spillways, a crest with a chute or stepped face below it, are the most common; side-channel spillways run along a valley wall; labyrinth spillways fold the crest into a zigzag to fit more length into a narrow site; and fuse plugs are erodible embankment sections designed to wash out in a rare flood and open an emergency channel. The discharge over a crest follows the weir equation:
where \(L\) is the crest length and \(H\) the head above the crest. A reservoir with a large surface area attenuates the flood: water rises above the crest, storing part of the inflow, and the peak outflow is less than the peak inflow. The level-pool routing method from CIV-370 applies, with continuity \(dS/dt = I - O\) and the spillway rating relating the outflow to the level. The design check is that the routed maximum level leaves the required freeboard below the dam crest.
# Kestrel Lake dam: sediment trap efficiency and spillway check for the inflow design flood
from math import log10
UNITS = "SI"
SI = UNITS == "SI"
C = 420e3                       # total capacity, m3
A = 3.1                         # drainage area, km2
I = 0.88e6                      # mean annual inflow, m3
yield_t = 35.0                  # sediment yield, t/km2/yr (illustrative)
rho = 1.10                      # dry bulk density of deposits, t/m3
CI = C / I
TE = 0.97 ** (0.19 ** log10(CI))          # Dendy's fit to Brune's median curve
loss = yield_t * A * TE / rho             # m3/yr trapped
print(f"C/I = {CI:.2f}; Brune trap efficiency {TE:.0%}; storage lost {loss:.0f} m3/yr" if SI else
      f"C/I = {CI:.2f}; Brune trap efficiency {TE:.0%}; storage lost {loss/1233.5:.2f} acre-ft/yr")
print(f"Years to lose 20 % of capacity: {0.2 * C / loss:.0f}")

# level-pool routing of a triangular inflow hydrograph over a free overflow spillway
area = 9.5e4                    # reservoir surface area, m2 (taken constant)
Cw = 1.70                       # broad-crested weir coefficient, SI
def route(Qp, Tp_h, Lw, dt=60.0):
    tb = 2.67 * Tp_h * 3600
    h, out_max, h_max, t = 0.0, 0.0, 0.0, 0.0
    while t < 4 * tb:
        qin = Qp * t / (Tp_h * 3600) if t < Tp_h * 3600 else max(0.0, Qp * (tb - t) / (tb - Tp_h * 3600))
        qout = Cw * Lw * h ** 1.5
        h = max(0.0, h + (qin - qout) * dt / area)
        out_max, h_max, t = max(out_max, qout), max(h_max, h), t + dt
    return out_max, h_max
crest_to_dam = 2.0              # height of the dam crest above the spillway crest, m
freeboard = 0.6                 # minimum freeboard above the routed level, m
cases = [("1-in-1000-year flood", 24.0), ("1/3 between 1-in-1000 and PMF", 39.0), ("PMF", 70.0)]
for Lw in (8.0, 12.0):
    print(f"\nSpillway crest length {Lw:.0f} m" if SI else f"\nSpillway crest length {Lw/0.3048:.0f} ft")
    for name, Qp in cases:
        qo, hm = route(Qp, 2.0, Lw)
        fb = crest_to_dam - hm
        if SI:
            print(f"  {name:30s} inflow {Qp:5.1f} m3/s  outflow {qo:5.1f}  head {hm:4.2f} m  freeboard {fb:4.2f} m  {'OK' if fb >= freeboard else 'too little'}")
        else:
print(f" {name:30s} inflow {Qp*35.315:5.0f} cfs outflow {qo*35.315:5.0f} head {hm/0.3048:4.2f} ft freeboard {fb/0.3048:4.2f} ft {'OK' if fb >= freeboard else 'too little'}")C/I = 0.48; Brune trap efficiency 95%; storage lost 94 m3/yr Years to lose 20 % of capacity: 897 Spillway crest length 8 m 1-in-1000-year flood inflow 24.0 m3/s outflow 14.8 head 1.06 m freeboard 0.94 m OK 1/3 between 1-in-1000 and PMF inflow 39.0 m3/s outflow 25.9 head 1.54 m freeboard 0.46 m too little PMF inflow 70.0 m3/s outflow 50.5 head 2.40 m freeboard -0.40 m too little Spillway crest length 12 m 1-in-1000-year flood inflow 24.0 m3/s outflow 16.7 head 0.88 m freeboard 1.12 m OK 1/3 between 1-in-1000 and PMF inflow 39.0 m3/s outflow 28.9 head 1.26 m freeboard 0.74 m OK PMF inflow 70.0 m3/s outflow 55.3 head 1.94 m freeboard 0.06 m too little
Reading the results
With the existing 8 m crest, the 1-in-1,000-year flood rises 1.06 m over the crest and leaves 0.94 m of freeboard, but the inflow design flood rises 1.54 m and leaves only 0.46 m, below the 0.6 m the team requires for wave run-up and settlement. Widening the crest to 12 m passes the inflow design flood with 0.74 m of freeboard. Neither crest passes the PMF: it would overtop the embankment by 0.40 m with the existing spillway, and come within 0.06 m of the crest with the wider one. Since the dam is not rated extreme, the PMF is a check, not a requirement, but the result shows how sensitive the dam is to floods beyond the design.
Attenuation by the lake is significant: the peak outflow is about two thirds of the peak inflow in every case, because the lake surface stores the first part of the flood. A lake with a smaller area would need a longer crest for the same safety.
Reservoir sedimentation
Every reservoir traps sediment carried in by its streams, losing storage over time. The fraction trapped, the trap efficiency, depends mainly on the ratio of capacity to mean annual inflow, \(C/I\): large reservoirs that hold the water for months trap nearly everything, while small ones on large rivers pass much of the finer sediment through. Brune's 1953 curves, based on many US reservoirs, remain the standard first estimate. A convenient fit to his median curve is
The annual loss of storage is the sediment yield of the watershed, in tonnes per km² per year, times the area and the trap efficiency, divided by the dry density of the deposits. Sediment yields vary by orders of magnitude, from a few tonnes per km² a year in forested shield country to thousands in erodible agricultural or semi-arid basins, and should be measured or estimated from nearby reservoir surveys where possible. Deposits settle first where the stream enters the lake, forming a delta that advances toward the dam, and finer material spreads along the bottom.
Worked problem
Storage loss in Kestrel Lake
Kestrel Lake holds 420,000 m³ in total and receives a mean inflow of about 0.88 million m³ a year from 3.1 km². The forested watershed yields about 35 t/km² of sediment a year, and the deposits have a dry density of about 1.10 t/m³. Estimate the annual loss of storage and the time to lose 20 % of the capacity.
Show solution
- \[C/I = \frac{420{,}000}{880{,}000} = 0.48\]
- \[E = 0.97^{\,0.19^{\log_{10} 0.48}} = 0.97^{\,0.19^{-0.32}} = 0.97^{1.70} = 0.95\]
- Sediment trapped: \(35 \times 3.1 \times 0.95 = 103\) t/yr, a volume of \(103/1.10 = 94\ \text{m}^3\) a year.
- \[t_{20\%} = \frac{0.2 \times 420{,}000}{94} \approx 900\ \text{years}\]
Answer: Sedimentation is not a threat to Kestrel Lake's storage on any planning horizon. The forested watershed and the lake's long residence time keep losses small, though construction in the watershed should still use erosion and sediment controls.
Dam safety management
A safe dam needs more than adequate structures. The owner should keep an operation, maintenance and surveillance manual; inspect routinely and after floods and earthquakes; monitor instruments such as piezometers, seepage weirs and survey points; and maintain an emergency preparedness plan with inundation maps, warning procedures and contacts. A formal dam safety review every several years, by qualified engineers, checks the whole dam against current standards. For Kestrel Lake, the master plan recommends the spillway widening, a new outlet conduit with a filter diaphragm, piezometers and a seepage weir at the toe, and an emergency plan coordinated with the city's emergency management office.
Practical points
- Classify the dam by the consequences of failure before choosing the design flood.
- Route the inflow design flood through the reservoir; attenuation can be large.
- Check freeboard for wind, waves and settlement, not just the still-water level.
- Treat conduits through embankments as the most likely path for internal erosion.
- Estimate sediment loss early; it decides whether a reservoir has a life of decades or centuries.
Common mistakes
MistakeDesigning the spillway for the 100-year flood because that is the standard for culverts.
InsteadDam spillways are designed for floods set by the consequence of failure, often far rarer than 100 years.
MistakeIgnoring reservoir storage in the spillway check.
InsteadRoute the flood; the lake attenuates the peak.
MistakeAssuming the freeboard is simply the head above the crest.
InsteadFreeboard is measured from the routed maximum level to the dam crest and must allow for waves and settlement.
MistakeUsing a single sediment yield from the literature without checking local data.
InsteadYields vary by orders of magnitude; use local surveys or regional studies.
Summary and key terms
- Dams are embankment or concrete structures; embankments fail mainly by overtopping, internal erosion and instability.
- The CDA guidelines classify dams by consequence of failure and set the inflow design flood from that class.
- The PMF results from the probable maximum precipitation and is the most extreme design flood.
- Level-pool routing over the spillway rating gives the maximum level and the freeboard.
- Kestrel Lake's 8 m spillway leaves 0.46 m of freeboard in the inflow design flood; a 12 m crest leaves 0.74 m.
- Brune's curve gives trap efficiency from the ratio of capacity to inflow; Kestrel Lake traps 95 % but loses storage very slowly.
- Embankment dam
- A dam built of compacted earth or rockfill.
- Internal erosion
- Removal of soil particles by seepage within an embankment or its foundation, also called piping.
- Inflow design flood
- The flood a dam must pass without failure, chosen from its consequence or hazard class.
- Probable maximum flood
- The largest flood reasonably possible at a site, from the probable maximum precipitation.
- Freeboard
- The vertical distance from the maximum reservoir level to the dam crest.
- Fuse plug
- An erodible section of embankment designed to wash out and open an emergency spillway in a rare flood.
- Trap efficiency
- The fraction of the incoming sediment that a reservoir retains.
- Dam-break analysis
- A study of the flood wave released by a hypothetical breach, used to map consequences.
Practice problems
Work each problem on paper first, then reveal the answer to check.
A spillway crest 10 m long has \(C_w = 1.70\). Find the discharge at a head of 1.2 m.
Show answer
\(Q = 1.70(10)(1.2)^{1.5} = 22.3\) m³/s.
A reservoir has \(C/I = 0.05\). Estimate its trap efficiency with the Brune fit.
Show answer
\(\log_{10} 0.05 = -1.30\); \(0.19^{-1.30} = 8.68\); \(E = 0.97^{8.68} = 0.77\).
Why are conduits through embankments a common location for internal erosion?
Show answer
Compaction is difficult around them, seepage concentrates along the contact, and cracks can form; filters around the conduit control the risk.
Why does the peak outflow from a reservoir fall below the peak inflow?
Show answer
Water stored as the level rises above the crest delays and reduces the outflow peak.
Lesson quiz · 5 questions
Score 60% or more to complete this lesson.
Create a free account to save your progress, take quizzes and earn a certificate.