
CIV-470 · Lesson 1 of 12 · 21 min
Water resources planning and management
In CIV-370 the Kestrel Bay team learned to describe how water moves: in channels, through structures, over the land and through the year. This course asks what engineers do with that knowledge when a whole watershed must be managed. Water resources engineering is the planning and design of the works that store water, convey it, control floods, protect rivers and supply people, and it always involves trade-offs between those purposes. The case for the course is a watershed master plan for Kestrel Creek, commissioned by the City of Thunder Bay with the Lakehead Region Conservation Authority.
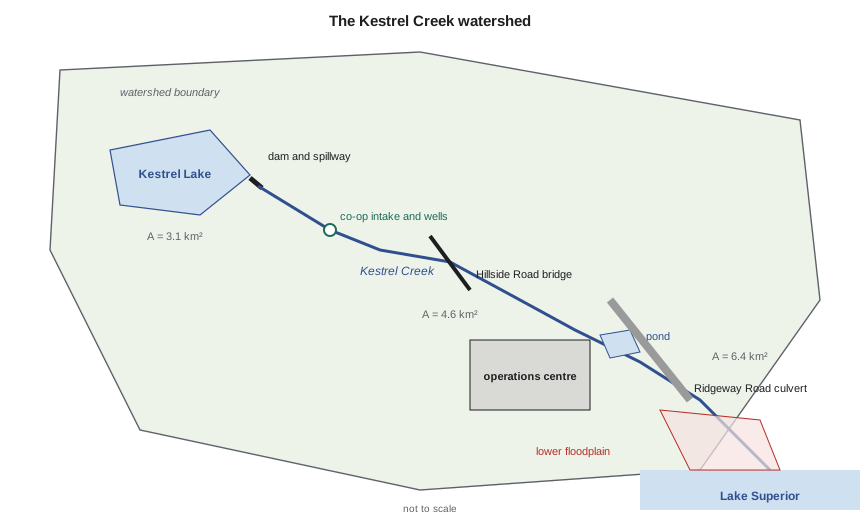
Anika Rao, the firm's water resources lead, sets out the scope at the kick-off meeting. The plan must cover five things that earlier projects treated separately: the small Kestrel Lake dam at the head of the watershed, which supplies a rural water co-op; stormwater from the expanding operations centre; the creek crossings at Ridgeway Road and Hillside Road; the flood risk to the lower creek near the lake; and the effect of a changing climate on all of them. Owen Lachance, now an engineer in training, will run most of the calculations, and Sofia Martel, the co-op student, will build the Python tools.
What water resources engineering covers
Water resources engineering grew from irrigation, navigation and water supply, and today it spans four broad purposes. Water supply means finding a reliable source, whether surface water stored in reservoirs, water drawn from rivers and lakes, or groundwater, and delivering it at the quality and pressure users need. Flood management means reducing the damage floods cause, by structures such as dams, dikes and larger crossings, and by non-structural measures such as floodplain regulation, warning and land use planning. Drainage and stormwater management means collecting runoff from developed land, conveying it safely and controlling its quantity and quality before it reaches a receiving water. Environmental protection means keeping enough water in streams for fish and other life, maintaining the shape and habitat of channels, and protecting water quality.
These purposes compete. A reservoir kept full for water supply has little room to absorb a flood; a reservoir kept low for flood control may not refill in a dry year. A culvert sized only for hydraulic capacity may block fish; a channel straightened to pass floods may lose its habitat and erode its banks. The engineer's job is to make the trade-offs explicit, quantify them and help the owner and the public choose.
The planning process
Water resources plans follow a recognizable sequence, whether the subject is a small creek or a large river basin. The team first defines the problem and the objectives with the owner and the agencies: what must the plan achieve, over what period, and how will success be judged? It then gathers data: flows, rainfall, water levels, water use, land use, channel surveys, infrastructure condition and environmental information. Next it forecasts the future, including growth in water demand, changes in land use and changes in climate. It develops alternatives, evaluates them against the objectives, usually with a mix of costs, risks and benefits that cannot all be expressed in money, and recommends a plan with priorities and a schedule. Public and Indigenous engagement runs through every step, not just the end.
In Ontario, municipal infrastructure plans of this kind usually follow the Municipal Class Environmental Assessment process, which sets out phases for problem definition, alternatives, public consultation and documentation. A watershed master plan can satisfy the early phases for the projects it identifies, so that individual projects later move more quickly. The Lakehead Region Conservation Authority's watershed knowledge and its regulatory role under the Conservation Authorities Act make it a key partner.
The water balance
Every water resources study starts with a water balance: over a chosen period and area, inflow minus outflow equals the change in storage. For a watershed over many years, storage changes little, so precipitation is shared between evapotranspiration, runoff that leaves in the stream and recharge that enters the groundwater. In the Kestrel Creek watershed, the long-term values the team adopts are about 712 mm of precipitation a year and 430 mm of evapotranspiration, leaving about 282 mm to leave the watershed as streamflow or groundwater. About a quarter of that recharges the aquifers, which matters in lesson 11.
The balance also frames demand. A water user taking a small fraction of the mean flow may still cause harm in a dry month, because the mean hides the low flows when fish are most stressed. Water resources planning therefore looks at the whole flow regime: the mean, the seasonal pattern, the low-flow statistics such as the 7-day low flow with a 10-year return period (often written 7Q10), and the floods.
Worked problem
Water balance and demand for the Kestrel Water Co-op
The Kestrel Water Co-op serves about 1,200 people from Kestrel Lake and supplies wash water to the operations centre. Use 300 L per person per day, 40 m³ per day for the wash bay, 1.5 % population growth a year and a maximum day factor of 2.0. Compare the demand in 25 years with the mean flow at the Ridgeway Road culvert.
Show solution
- Mean flow at the culvert from the water balance:
- \[\bar{Q} = \frac{0.282\ \text{m} \times 6.4 \times 10^{6}\ \text{m}^2}{3.156 \times 10^{7}\ \text{s}} = 0.057\ \text{m}^3/\text{s} = 57\ \text{L/s}\]
- Population in 25 years: \(1{,}200 \times 1.015^{25} = 1{,}741\).
- \[Q_{\text{avg}} = \frac{1{,}741 \times 300}{1{,}000} + 40 = 562\ \text{m}^3/\text{d} = 6.5\ \text{L/s}\]
- Ratio to the mean flow: \(6.5/57 = 11\%\). Maximum day: \(1{,}741 \times 0.300 \times 2.0 + 40 = 1{,}085\ \text{m}^3/\text{d}\).
Answer: The year-25 average demand is about 11 % of the mean flow at the culvert, but a much larger share of the flow at the dam and of the low flow in a dry summer. The co-op needs storage, and a permit.
# Kestrel Creek: annual water balance, demand projection and permit thresholds
UNITS = "SI"
SI = UNITS == "SI"
A_km2 = 6.4                      # watershed to the Ridgeway Road culvert
P, ET = 712.0, 430.0             # mean annual precipitation and evapotranspiration, mm (illustrative)
R = P - ET                       # long-term runoff + recharge, mm (storage change ~ 0)
recharge = 70.0                  # part of R that goes to groundwater, mm
vol = R / 1000 * A_km2 * 1e6     # m3 per year leaving the watershed
qmean = vol / (365.25 * 86400)   # mean flow, m3/s
if SI:
    print(f"Runoff + recharge = {P:.0f} - {ET:.0f} = {R:.0f} mm/yr  ->  {vol/1e6:.2f} million m3/yr")
    print(f"Mean annual flow at the culvert = {qmean*1000:.0f} L/s; recharge share {recharge/R:.0%}")
else:
    print(f"Runoff + recharge = {P/25.4:.1f} - {ET/25.4:.1f} = {R/25.4:.1f} in./yr  ->  {vol/1233.5:.0f} acre-ft/yr")
    print(f"Mean annual flow at the culvert = {qmean*35.315:.1f} cfs; recharge share {recharge/R:.0%}")

# demand of the rural water co-op served from Kestrel Lake, plus the operations site wash bay
pop0, growth, years = 1200, 0.015, 25
lpcd = 300.0                     # average day, L per person per day
wash = 40.0                      # operations site vehicle wash, m3/d
maxday = 2.0                     # maximum day / average day
print()
for yr in (0, 10, 25):
    pop = pop0 * (1 + growth) ** yr
    avg = pop * lpcd / 1000 + wash          # m3/d
    mx = pop * lpcd / 1000 * maxday + wash
    if SI:
        print(f"Year {yr:2d}: population {pop:5.0f}  average day {avg:5.0f} m3/d ({avg/86.4:4.1f} L/s)  maximum day {mx:5.0f} m3/d")
    else:
        print(f"Year {yr:2d}: population {pop:5.0f}  average day {avg*264.17/1e3:5.0f} thousand gal/d ({avg/86.4*15.85:4.0f} gpm)  maximum day {mx*264.17/1e3:5.0f} thousand gal/d")
avg25 = pop0 * (1 + growth) ** years * lpcd / 1000 + wash
print(f"\nYear-25 average demand is {avg25/86.4/(qmean*1000):.0%} of the mean flow at the culvert")
if SI:
    limit = 50.0                 # Ontario: permit to take water above 50,000 L/d
    print(f"Permit to take water needed? {avg25:.0f} m3/d against the 50 m3/d threshold: {'yes' if avg25 > limit else 'no'}")
else:
    limit = 10000 / 264.17       # Minnesota: appropriation permit above 10,000 gal/d (or 1 million gal/yr)
print(f"Water appropriation permit needed? {avg25*264.17:,.0f} gal/d against 10,000 gal/d: {'yes' if avg25 > limit else 'no'}")Runoff + recharge = 712 - 430 = 282 mm/yr -> 1.80 million m3/yr Mean annual flow at the culvert = 57 L/s; recharge share 25% Year 0: population 1200 average day 400 m3/d ( 4.6 L/s) maximum day 760 m3/d Year 10: population 1393 average day 458 m3/d ( 5.3 L/s) maximum day 876 m3/d Year 25: population 1741 average day 562 m3/d ( 6.5 L/s) maximum day 1085 m3/d Year-25 average demand is 11% of the mean flow at the culvert Permit to take water needed? 562 m3/d against the 50 m3/d threshold: yes
Who decides: water law and agencies
Engineers design within a legal framework that allocates water, regulates works in and near water and protects fish and water quality. The details differ by jurisdiction, but the questions are the same: who may take water and how much, who may build in a stream or floodplain, and who is responsible if a dam or channel fails.
In Canada, provinces own and manage most water. In Ontario, anyone taking more than 50,000 litres a day from surface water or groundwater needs a permit to take water under the Ontario Water Resources Act, issued by the Ministry of the Environment, Conservation and Parks, with conditions on rates and monitoring. Dams and other works in lakes and rivers are approved under the Lakes and Rivers Improvement Act, administered by the provincial natural resources ministry. Conservation authorities regulate development and alteration of watercourses in hazard lands under the Conservation Authorities Act and its regulation on prohibited activities, exemptions and permits (Ontario Regulation 41/24), which replaced the older authority-by-authority regulations in 2024. Federal law adds the Fisheries Act, which protects fish and fish habitat, and the Canadian Navigable Waters Act. Water taken from the Great Lakes basin is also subject to the Great Lakes–St. Lawrence River Basin Sustainable Water Resources Agreement between the provinces and states.
Indigenous rights add another layer. Treaties and the rights of Indigenous nations to water, fish and traditional uses must be respected, and the duty to consult falls on governments but shapes how engineers plan engagement and schedule work. On Kestrel Creek, the team includes the nearby First Nation's lands and resources office in its engagement list from the start.
Conservation authorities and watershed organizations
Ontario's conservation authorities are a distinctive Canadian institution: watershed-based agencies, created by member municipalities and the province, that manage natural hazards, review planning applications for hazard and natural heritage issues, own conservation lands and run monitoring programs. The Lakehead Region Conservation Authority covers the Thunder Bay area. For Kestrel Creek it holds the flood standard (the 100-year flood), the Lake Superior 100-year level of about 184.0 m, the regulated area along the shoreline and the creek, and the permits the works will need.
| Question | Ontario | Kestrel Creek item |
|---|---|---|
| Taking water | Permit to take water above 50,000 L/d | Co-op supply from the lake and wells |
| Building a dam or in a stream | Lakes and Rivers Improvement Act approval | Spillway widening, culvert, bridge works |
| Development near hazards | Conservation authority permit (O. Reg. 41/24) | Floodplain, shoreline, valley slopes |
| Fish and habitat | Fisheries Act (federal) | Culvert fish passage, low-flow releases |
| Stormwater quality | Ministry approval of stormwater works | Operations centre ponds and LID |
Demand forecasting
Water demand is usually forecast as population times a per capita rate, plus non-residential users, with peaking factors for the maximum day and peak hour. Per capita rates fell in many North American cities after about 2000 as low-flow fixtures and water metering spread, so using an old rate overstates demand and the cost of new works. The forecast should test a range of growth and a range of rates, and it should show how conservation programs and leak reduction change the result. Climate change enters through higher summer demand for lawns and gardens in longer, warmer summers, and through changes in supply, the subject of lesson 2.
For the co-op, the team adopts 300 litres per person per day, based on two years of metered data, and a maximum day factor of 2.0, typical of small rural systems where lawn watering dominates summer peaks. The 25-year average demand of about 6.5 L/s becomes the draft on Kestrel Lake in lesson 2, together with a minimum release to the creek for fish.
Reading the results
The annual water balance gives a mean flow at the culvert of about 57 L/s, and the co-op's demand grows from 4.6 to 6.5 L/s over 25 years. That is only 11 % of the mean flow at the culvert, but the dam controls only 3.1 km² of the 6.4 km² watershed, so the draft is close to half of the mean inflow to Kestrel Lake, and far more than the dry-summer inflow. The co-op's existing permit to take water will need to be renewed with the higher rate, and the ministry will ask how the minimum release to the creek is protected in drought.
Practical points
- Start every study with a water balance; it catches errors of an order of magnitude early.
- Look beyond the mean flow to the low flows and the floods; the extremes drive the design.
- List the approvals at the start; they set the schedule and often the design criteria.
- Forecast demand as a range, and show the effect of conservation and leak reduction.
- Engage agencies, the public and Indigenous nations early, and keep a record of what was heard and how it changed the plan.
Common mistakes
MistakeComparing a demand with the mean annual flow and concluding that supply is ample.
InsteadCompare it with low flows and with the flow at the point of withdrawal, which may drain only part of the watershed.
MistakeUsing an old per capita rate for a new forecast.
InsteadUse recent metered data; rates have fallen in many systems.
MistakeTreating permits as a final step.
InsteadApprovals set criteria such as fish passage and flood levels that shape the design from the start.
MistakePlanning each work in isolation.
InsteadA master plan finds interactions: storage affects floods, culverts affect fish, pumping affects other wells.
Summary and key terms
- Water resources engineering covers water supply, flood management, drainage and stormwater, and environmental protection, which often compete.
- Planning moves from objectives and data through forecasts and alternatives to a recommended plan, with engagement throughout.
- The long-term water balance shares precipitation between evapotranspiration, runoff and recharge.
- Kestrel Creek yields about 282 mm a year, a mean flow of 57 L/s at the culvert; the co-op's year-25 demand is 6.5 L/s.
- Water takings above 50,000 L/d need a provincial permit; conservation authorities regulate work in hazard lands.
- Demand forecasts combine population, per capita use and peaking factors, and should be tested over a range.
- Water balance
- An accounting of inflow, outflow and change in storage for a defined area and period.
- Evapotranspiration
- Water returned to the atmosphere by evaporation from surfaces and transpiration by plants.
- Recharge
- Water that moves down from the surface to replenish groundwater.
- 7Q10
- The lowest average flow over 7 consecutive days expected once in 10 years on average.
- Maximum day factor
- The ratio of the highest daily demand in a year to the average daily demand.
- Watershed
- The land area that drains to a given point on a stream.
- Conservation authority
- An Ontario watershed-based agency that manages natural hazards and regulates development in hazard lands.
- Riparian rights
- Rights of landowners along a water body to make reasonable use of the water.
Practice problems
Work each problem on paper first, then reveal the answer to check.
A watershed of 12 km² receives 750 mm of precipitation a year and loses 460 mm to evapotranspiration. Estimate the mean flow at its outlet.
Show answer
\(R = 290\) mm, \(\bar{Q} = 0.290 \times 12 \times 10^6 / 3.156 \times 10^7 = 0.110\) m³/s.
A town of 3,000 people uses 280 L per person per day with a maximum day factor of 1.8. Find the average and maximum day demand.
Show answer
Average 840 m³/d (9.7 L/s); maximum 1,512 m³/d (17.5 L/s).
Why can a withdrawal of 10 % of the mean annual flow still harm a stream?
Show answer
Low flows in dry months may be a small fraction of the mean, so the same withdrawal can be a large share of the summer flow when fish are most stressed.
Name two ways a watershed master plan helps individual projects later.
Show answer
It identifies interactions and priorities, and it can satisfy the early planning and consultation steps so that projects proceed faster.
Lesson quiz · 5 questions
Score 60% or more to complete this lesson.
Create a free account to save your progress, take quizzes and earn a certificate.