
CIV-380 · Lesson 1 of 12 · 19 min
Water quality targets and regulations
A year after the preliminary studies of CIV-280, Willowbend Environmental in Brandon, Manitoba, has won the detailed design of two plants for the city. The first is the new drinking water treatment plant that will take water from the Assiniboine River and the off-stream reservoir, sized for 40,000 m³/d on an average day and 60,000 m³/d on a peak day. The second is the upgrade of the city's wastewater treatment plant, which treats about 30,000 m³/d and must now meet tighter limits on phosphorus and nitrogen. Nadia Okoro, now in her second year as an engineer-in-training, leads the process calculations under Martin Lefebvre, the firm's senior process engineer, with Joy Kwan running the laboratory and pilot work.
This course follows both plants through their unit processes, one lesson at a time. Before any tank is sized, though, the design team needs to know what the plants must achieve. Every process choice, from the coagulant dose to the length of time sludge stays in an aeration tank, traces back to a number in a guideline, a regulation or a permit. This lesson sets out where those numbers come from, how they are enforced, and how a designer turns them into design targets with a margin of safety.
Treatment as a series of barriers
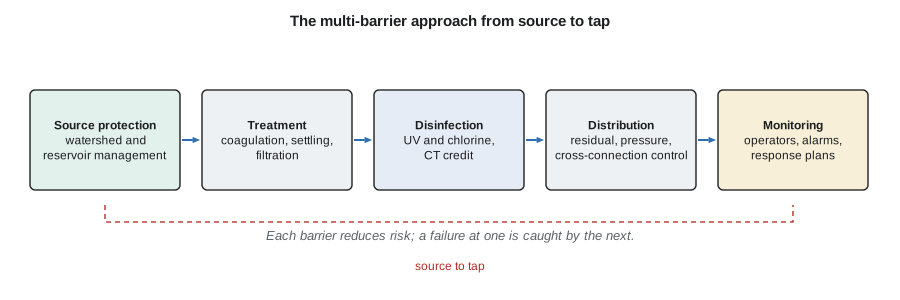
Modern drinking water practice rests on the multi-barrier approach: no single step is relied on to protect public health. Source water protection keeps contaminants out of the river and the reservoir; treatment removes or inactivates what gets through; a disinfectant residual protects the water in the distribution system; and monitoring, trained operators and emergency plans catch failures before they reach consumers. The same idea applies, in reverse, to wastewater: collection, treatment, disinfection where needed and monitoring together protect the river downstream.
Two Canadian tragedies made the approach concrete. In Walkerton, Ontario, in 2000, manure-borne E. coli O157:H7 and Campylobacter entered a shallow well after heavy rain; chlorination was inadequate and monitoring was falsified, and seven people died. In North Battleford, Saskatchewan, in 2001, Cryptosporidium passed through a poorly operated surface water plant and thousands fell ill. In the United States, the 1993 Milwaukee Cryptosporidium outbreak sickened an estimated 400,000 people, and the Flint crisis of 2014 to 2015 showed how a change in source water and corrosion control can release lead from pipes. Each event led to stronger rules, and each is a reminder that regulations are written in response to real failures.
Guidelines, regulations and permits
A guideline is a recommended value based on health or aesthetic considerations; it becomes enforceable only when a law adopts it. A regulation is a legal requirement that applies to all systems of a given type. A licence or permit is a legal instrument issued to one facility, setting limits and monitoring requirements specific to that plant and its receiving water. A designer has to work with all three.
In Canada, drinking water is mainly a provincial responsibility. Health Canada, working with the provinces and territories through a federal-provincial-territorial committee, publishes the Guidelines for Canadian Drinking Water Quality. Each guideline sets a maximum acceptable concentration (MAC) for a health-based parameter, an aesthetic objective (AO) for taste, odour or colour, or an operational guidance value for treatment. The provinces adopt the guidelines into law in their own way. In Manitoba, the Drinking Water Safety Act and its regulations require each public water system to hold an operating licence issued by the Office of Drinking Water, to meet the provincial drinking water quality standards, to use certified operators and to follow a sampling and reporting schedule. Ontario, which has the most detailed framework after Walkerton, sets its standards in O. Reg. 169/03 and its treatment and sampling requirements in O. Reg. 170/03.
Wastewater effluent in Canada is regulated at two levels. The federal Wastewater Systems Effluent Regulations (WSER) under the Fisheries Act apply to systems that can discharge 100 m³/d or more, and set national minimum standards for secondary treatment: an average carbonaceous BOD₅ of 25 mg/L, suspended solids of 25 mg/L, total residual chlorine of 0.02 mg/L and un-ionized ammonia of 1.25 mg/L as N at 15 °C. Provinces add their own requirements through licences. Manitoba's Water Quality Standards, Objectives and Guidelines require secondary treatment, an E. coli or fecal coliform limit of 200 per 100 mL where disinfection applies, total phosphorus of 1 mg/L for facilities discharging more than 820 kg of phosphorus a year (roughly a community of 2,000), and a total nitrogen standard of 15 mg/L, with site-specific requirements for large plants. The nutrient limits reflect the province's concern for Lake Winnipeg, which receives the Assiniboine via the Red River and suffers severe algal blooms.
Key drinking water parameters
The table below lists values used throughout this course. They are summarized here for design; the current official documents should always be checked, because values change as health evidence develops.
| Parameter | Canadian guideline | Basis |
|---|---|---|
| E. coli and total coliforms | None detectable per 100 mL | Microbiological indicator |
| Enteric protozoa and viruses | Treatment goal: at least 3-log Giardia and Cryptosporidium, 4-log viruses | Treatment-based |
| Turbidity (conventional filtration) | 0.3 NTU in 95 % of measurements per filter, never above 1.0 NTU | Treatment-based |
| Nitrate | 45 mg/L as nitrate (10 mg/L as N) | MAC |
| Lead | 0.005 mg/L at the tap | MAC (2019) |
| Manganese | 0.12 mg/L (MAC) and 0.02 mg/L (AO) | MAC and AO (2019) |
| Total trihalomethanes | 0.100 mg/L, locational running annual average | MAC |
| Five haloacetic acids (HAA5) | 0.080 mg/L, locational running annual average | MAC |
| PFAS | 30 ng/L for the sum of 25 PFAS | Objective (2024) |
| Hardness | No guideline; 80 to 100 mg/L as CaCO₃ is a common target for balance | Aesthetic consideration |
Two parameters are changing as this course is written. For PFAS, Health Canada set an objective in 2024 of 30 ng/L for the sum of 25 specific compounds, and encourages utilities to reduce levels as far as reasonably possible. For lead, the 2019 guideline of 0.005 mg/L at the tap, combined with sampling protocols that capture water that has stood in pipes, is stricter than older practice and is driving lead service line replacement programs across the country.
From standard to design target
A plant that is designed to just meet a limit will exceed it. Influent quality varies, equipment fails, operators change and analytical results scatter. Designers therefore set design targets well inside the limits. Common practice for drinking water is to aim for a filtered water turbidity of 0.1 NTU or less, a third of the regulatory value, and for wastewater to design for an average effluent concentration around half to two thirds of a monthly permit limit, so that the variable day-to-day performance still keeps the monthly average compliant.
The statistical form of each limit matters as much as the number. A maximum applies to every sample. A running annual average, used for disinfection by-products, smooths seasonal peaks, so a plant can exceed the value in one quarter and still comply if the yearly average stays below the limit. A percentile, used for turbidity and for lead, allows a small share of results to be high. A rolling 30-day average, used for Manitoba's phosphorus standard, responds to a short upset within weeks. Nadia's first task is to build a table that lists, for each parameter, the limit, its statistical form, the sampling location and the design target that the process will be sized to achieve.
Worked problem
Screening a month of results
The city's existing groundwater-blended supply produced the following results last month: nitrate 3.1 mg/L as N, lead at one home tap 0.0062 mg/L, manganese 0.035 mg/L, total trihalomethanes 0.071 mg/L, HAA5 0.044 mg/L and the sum of 25 PFAS 9 ng/L. Which, if any, are above the Canadian values in the table?
Show solution
- Compare each result with its value:
- \[0.0062 > 0.005\ \text{mg/L (lead)}\]
- All others are below their values. Lead at one tap exceeds the MAC, which points to the plumbing or service line at that home rather than to treatment, because lead enters water after it leaves the plant.
Answer: Only lead exceeds its value; the response is a corrosion control review and lead service line work, not a change to treatment targets.
The script below repeats the screen for the full set of results, computes the running annual average of trihalomethanes at one sampling location over five quarters, and checks a month of four-hourly combined filter turbidity readings against the 0.3 NTU, 95 % rule.
# Compliance screen for one month of treated-water results
UNITS = "SI"
CA = UNITS == "SI"
# (limit, unit) pairs; None means no enforceable health-based maximum
if CA:
    limits = {"nitrate as N": (10.0, "mg/L"), "lead at the tap": (5.0, "ug/L"),
              "manganese": (120.0, "ug/L"), "total trihalomethanes": (100.0, "ug/L"),
              "HAA5": (80.0, "ug/L"), "sum of 25 PFAS": (30.0, "ng/L")}
else:
    limits = {"nitrate as N": (10.0, "mg/L"), "lead, 90th percentile": (10.0, "ug/L"),
              "manganese": (None, "ug/L"), "total trihalomethanes": (80.0, "ug/L"),
              "HAA5": (60.0, "ug/L"), "PFOA": (4.0, "ng/L"), "PFOS": (4.0, "ng/L")}
results = {"nitrate as N": 3.1, "lead at the tap": 6.2, "lead, 90th percentile": 6.2,
           "manganese": 35.0, "total trihalomethanes": 71.0, "HAA5": 44.0,
           "sum of 25 PFAS": 9.0, "PFOA": 2.1, "PFOS": 3.6}
for k, (lim, u) in limits.items():
    v = results[k]
    if lim is None:
        print(f"{k:24s} {v:6.1f} {u:5s} no federal health-based maximum")
        continue
    word = "action level" if k.startswith("lead, 90") else "limit"
    status = "ok" if v <= lim else "above the " + word
    print(f"{k:24s} {v:6.1f} {u:5s} {word} {lim:g}: {status}")
# running annual average of quarterly TTHM at one sampling location (ug/L)
q = [52, 94, 88, 61, 83]
for i in range(3, len(q)):
    avg = sum(q[i-3:i+1]) / 4
    print(f"TTHM running annual average to quarter {i+1}: {avg:.1f} ug/L")
# 4-hourly combined filter effluent turbidity for a 30-day month (NTU)
import random
random.seed(7)
turb = [round(abs(random.gauss(0.09, 0.05)), 3) for _ in range(180)]
turb[50] = 0.42; turb[51] = 0.35
share = sum(1 for x in turb if x <= 0.3) / len(turb)
print(f"turbidity: {len(turb)} readings, maximum {max(turb):.2f} NTU, {100*share:.1f} % at or below 0.3 NTU")nitrate as N 3.1 mg/L limit 10: ok lead at the tap 6.2 ug/L limit 5: above the limit manganese 35.0 ug/L limit 120: ok total trihalomethanes 71.0 ug/L limit 100: ok HAA5 44.0 ug/L limit 80: ok sum of 25 PFAS 9.0 ng/L limit 30: ok TTHM running annual average to quarter 4: 73.8 ug/L TTHM running annual average to quarter 5: 81.5 ug/L turbidity: 180 readings, maximum 0.42 NTU, 98.9 % at or below 0.3 NTU
The running annual average ends the fifth quarter at 81.5 µg/L, below the Canadian 100 µg/L MAC, but the summer quarters reached 94 and 88 µg/L. The new plant's lower organic carbon must bring those peaks down, and the design target is set at 60 µg/L. The turbidity record shows two readings above 0.3 NTU in 180, or 98.9 % compliance, which meets the rule but signals a filter that needs attention.
Wastewater limits and the receiving water
Effluent limits are set either by technology, meaning what secondary treatment can reliably achieve, or by the receiving water, meaning what the river needs to meet its own water quality objectives. A technology-based limit is the same everywhere; a water-quality-based limit depends on the dilution available, the background concentration and the use of the river downstream. The Streeter-Phelps oxygen sag of CIV-280 is one tool for setting such limits; mass balances on ammonia, phosphorus and chloride are others. In a low-flow winter, the Assiniboine or the Big Sioux may provide only a few volumes of dilution for each volume of effluent, which is why ammonia limits are often stricter in winter even though nitrification is hardest then.
Un-ionized ammonia is toxic to fish at low concentrations, and its share of total ammonia rises steeply with pH and temperature. A plant that nitrifies converts ammonia to nitrate, removing the toxicity but adding nitrogen that feeds algae downstream. Removing that nitrate by denitrification, and removing phosphorus by biological or chemical means, is the subject of lesson 10. The city plant's new limits, and the costs of meeting them, are the reason for the upgrade studied in lesson 12.
Who designs, who approves, who operates
In Manitoba, the plant design must be prepared and sealed by a professional engineer registered with Engineers Geoscientists Manitoba. The water plant needs an Environment Act licence for construction and a permit and operating licence from the Office of Drinking Water; the wastewater upgrade needs an amended Environment Act licence. Operators must be certified at the level of the facility's classification. Willowbend's drawings will be reviewed by both offices, and the design report must show how each requirement is met.
Good regulation also relies on public reporting. Utilities publish annual reports of their results, and an exceedance usually triggers notification of the regulator within hours and of the public within days. Designers support this by providing enough sampling points, on-line analyzers and data systems to show compliance continuously rather than only on the day of a grab sample.
Common mistakes
MistakeTreating a guideline or permit limit as the design target.
InsteadDesign well inside the limit so that normal variability stays compliant.
MistakeIgnoring the statistical form of a limit.
InsteadA running annual average, a percentile and a single-sample maximum each require different margins.
MistakeAssuming every exceedance points to the treatment plant.
InsteadLead and some bacteria problems arise in distribution and building plumbing.
Summary and key terms
- The multi-barrier approach combines source protection, treatment, disinfection, a protected distribution system and monitoring.
- Health Canada's guidelines become enforceable through provincial law; Manitoba enforces them through licences issued by the Office of Drinking Water.
- WSER sets national secondary treatment minimums; provincial licences add nutrient and pathogen limits.
- Design targets sit well inside limits and account for the statistical form of each limit.
- Multi-barrier approach
- Protecting drinking water with several independent safeguards from source to tap.
- Maximum acceptable concentration
- A Canadian health-based guideline value for a substance in drinking water.
- Maximum contaminant level
- An enforceable US limit on a contaminant in drinking water.
- Treatment technique
- A required treatment process used instead of a numerical limit where measurement is impractical.
- Running annual average
- The average of the most recent four quarterly results at a location.
- Water-quality-based limit
- An effluent limit set to protect the specific receiving water.
- Design target
- The value a process is sized to achieve, set inside the regulatory limit.
Practice problems
Work each problem on paper first, then reveal the answer to check.
A disinfection by-product has quarterly results of 70, 110, 90 and 60 µg/L. Find the running annual average.
Show answer
\((70 + 110 + 90 + 60)/4 = 82.5\) µg/L.
Why is filtered water turbidity often targeted at 0.1 NTU when the rule allows 0.3 NTU?
Show answer
Low turbidity indicates effective particle removal, including pathogens, and leaves margin for upsets.
Give one reason a winter ammonia limit may be stricter than a summer one even though un-ionized ammonia is less toxic in cold water.
Show answer
Low winter river flow provides less dilution, so the allowable load is smaller.
Classify each as guideline, regulation or permit: a Health Canada MAC; 40 CFR Part 133; the city plant's discharge licence.
Show answer
Guideline; regulation; permit (or licence).
Lesson quiz · 5 questions
Score 60% or more to complete this lesson.
Create a free account to save your progress, take quizzes and earn a certificate.