
CISSP-110 · Lesson 11 of 12 · 28 min
Risk management: assessment, treatment, controls and monitoring
Risk management is the core of Domain 1 and, arguably, of the whole CISSP. Sub-domain 1.9 covers threat and vulnerability identification, risk analysis and assessment, risk response and treatment (including cyber insurance), types of controls, control assessments, continuous monitoring, reporting, continuous improvement and risk frameworks. This lesson builds the vocabulary and the calculations you need, then shows how the pieces fit into a cycle that keeps risk within the organization's appetite.
The vocabulary of risk
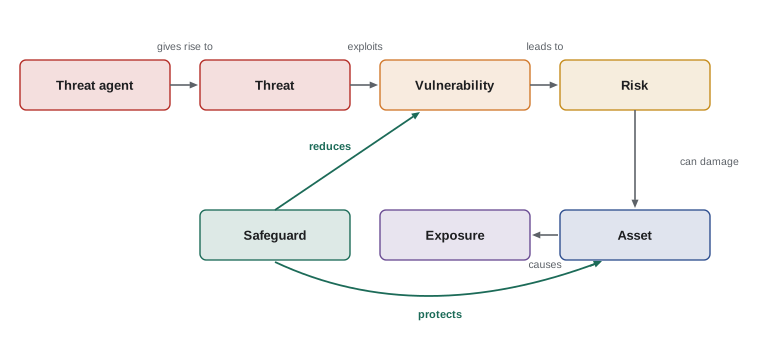
An asset is anything of value to the organization: information, systems, people, facilities, reputation. A threat is a potential cause of an unwanted incident, such as a ransomware group, a careless employee or a flood. A threat agent or threat actor is the entity that carries out the threat. A vulnerability is a weakness that a threat could exploit, such as an unpatched server or untrained staff. Exposure is being susceptible to loss from a threat. Risk is the likelihood that a threat will exploit a vulnerability, combined with the impact if it does. A safeguard or control reduces risk. Residual risk is the risk that remains after controls are applied; inherent risk is the risk before controls.
A simple way to remember the relationship is that risk exists where threats, vulnerabilities and valuable assets meet. Remove any one, for example by patching the vulnerability or not holding the asset, and that risk largely disappears. Total risk is sometimes written conceptually as threats × vulnerabilities × asset value, and residual risk as total risk minus the effect of controls, sometimes with a 'controls gap' term. These are conceptual statements rather than formulas to compute.
Identifying threats and vulnerabilities
Risk identification starts with an asset inventory and asset valuation, then asks what could go wrong. Sources include threat intelligence (reports from national cyber centres, industry groups and vendors), incident history, vulnerability scans and penetration tests, audit findings, interviews with business owners, and frameworks such as MITRE ATT&CK, which catalogues attacker tactics and techniques. Threat modelling (Lesson 12) structures this thinking for specific systems. The output is a risk register: a list of risks, each with a description, owner, likelihood, impact, existing controls, rating and planned treatment.
Risk assessment: scope and approach
Before assessing, define the scope (which systems, processes or business units), the criteria (scales for likelihood and impact, and the organization's risk appetite), and the approach. Risk assessments can be qualitative, quantitative or semi-quantitative. NIST SP 800-30 and ISO/IEC 27005 describe the process in detail.
Qualitative assessment rates likelihood and impact on descriptive scales, such as low, medium and high or 1 to 5, often plotted on a heat map. It is fast, easy to understand and useful when data is scarce, but subjective, and ratings are hard to compare or add up. Techniques such as the Delphi method, in which experts give anonymous estimates over several rounds until they converge, can reduce bias.
Quantitative assessment assigns monetary values and probabilities. It supports cost-benefit decisions and communicates in the language of executives, but needs data that is often unavailable and can give a false sense of precision. Semi-quantitative approaches assign numeric scores to qualitative scales. Models such as FAIR (Lesson 3) use ranges and simulation to give quantitative answers with honest uncertainty.
Quantitative risk calculations
The classic quantitative formulas appear on the exam and in practice:
The single loss expectancy (SLE) is the expected loss from one occurrence of a threat. Asset value (AV) is the value of the asset, and exposure factor (EF) is the percentage of that value lost in one occurrence.
The annualized loss expectancy (ALE) is the expected yearly loss. The annualized rate of occurrence (ARO) is how many times per year the threat is expected to occur; an event expected once every ten years has an ARO of 0.1.
A safeguard is cost-justified when its value is positive: it reduces expected annual losses by more than it costs each year. The annual cost should include purchase (spread over its useful life), implementation, maintenance, staff time and any productivity impact.
Worked problem
ALE and a cost-justified control
A customer database is valued at $2,000,000. A ransomware incident would destroy or expose about 40 per cent of its value through recovery costs, lost business and penalties. Such an incident is expected once every four years. A new immutable backup and endpoint detection service costing $90,000 a year would reduce the expected frequency to once every twenty years. Is the control justified?
Show solution
- SLE: \( 2{,}000{,}000 \times 0.40 = 800{,}000 \) dollars.
- ARO before: once in four years, \( 0.25 \). ALE before: \( 800{,}000 \times 0.25 = 200{,}000 \).
- ARO after: once in twenty years, \( 0.05 \). ALE after: \( 800{,}000 \times 0.05 = 40{,}000 \).
- Value: \( 200{,}000 - 40{,}000 - 90{,}000 = 70{,}000 \) dollars a year.
Answer: The control is justified, adding about $70,000 of value a year, before considering harder-to-price benefits such as reputation.
Worked problem
Insurance or mitigation?
For the same risk (ALE $200,000), an insurer offers a policy with a $250,000 deductible and a $1.5 million limit for a premium of $75,000 a year. Compare buying insurance alone with implementing the $90,000 control.
Show solution
- With the control: expected annual cost is \( 40{,}000 + 90{,}000 = 130{,}000 \).
- With insurance alone, each incident still costs the deductible: expected deductible cost \( 250{,}000 \times 0.25 = 62{,}500 \); the remaining loss per incident (\( 800{,}000 - 250{,}000 = 550{,}000 \)) is within the limit.
- Expected annual cost with insurance: \( 62{,}500 + 75{,}000 = 137{,}500 \), and the incidents, downtime and reputational damage still happen.
- Combining both: control reduces frequency, which may also lower the premium and keep the insurer willing to cover.
Answer: The control is slightly cheaper in expected terms and prevents harm rather than paying for it; in practice many organizations combine controls with insurance for residual catastrophic risk. Insurers increasingly require controls such as multi-factor authentication and tested backups as conditions of cover.
Qualitative scoring
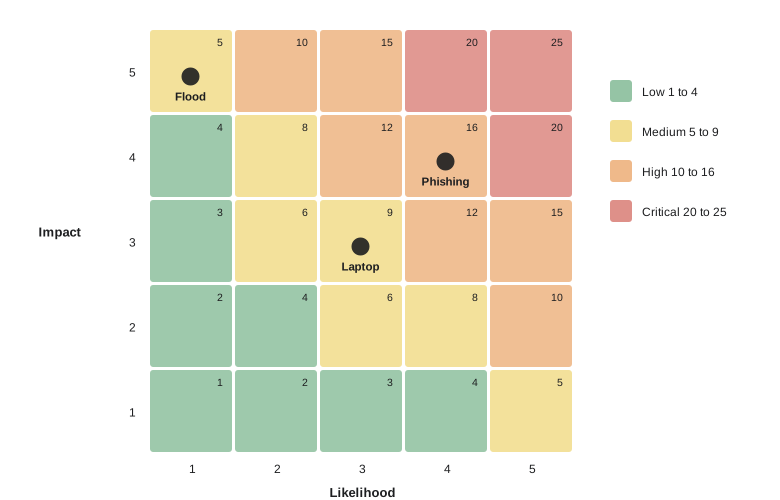
Qualitative assessments are more common in practice. A typical scheme rates likelihood and impact from 1 (very low) to 5 (very high), multiplies them for a score from 1 to 25, and maps scores to bands such as low (1 to 4), medium (5 to 9), high (10 to 16) and critical (20 to 25). Each band has a required response: critical risks must be treated immediately and reported to executives; low risks may be accepted by the risk owner.
Worked problem
Scoring and ranking risks
Rate three risks on 1 to 5 scales: (a) phishing leading to account compromise, likelihood 4, impact 4; (b) flood in the primary data centre, likelihood 1, impact 5; (c) loss of an unencrypted laptop, likelihood 3, impact 3. Using bands low 1 to 4, medium 5 to 9, high 10 to 16, critical 20 to 25, rank them.
Show solution
- (a) \( 4 \times 4 = 16 \): high.
- (b) \( 1 \times 5 = 5 \): medium, but note the catastrophic impact.
- (c) \( 3 \times 3 = 9 \): medium.
- Rank by score: (a), then (c), then (b). Flag (b) for continuity planning despite its lower score, because high-impact, low-likelihood risks can be underweighted by simple scoring.
Answer: Phishing first (16), laptop loss second (9), flood third (5), with a note that the flood's impact warrants continuity planning.
Risk response and treatment
Once risks are assessed, each needs a response decided by its owner within the organization's appetite and tolerance. The four classic responses are:
- Mitigate (reduce): apply controls to lower likelihood or impact, such as patching or adding multi-factor authentication.
- Transfer (share): shift some financial impact to another party, through cyber insurance or contracts. Accountability for protecting data is not transferred.
- Avoid: stop the activity that creates the risk, such as not launching a product in a market with unacceptable legal exposure, or not collecting certain data.
- Accept: knowingly retain the risk because treatment costs more than the expected loss or the risk is within appetite. Acceptance should be formal, documented and made by someone with authority.
Ignoring or rejecting a risk, pretending it does not exist, is not a valid response. Risk appetite is the amount of risk the organization is willing to pursue to achieve its objectives; risk tolerance is the acceptable variation around specific objectives; risk capacity is the most risk it could bear without failing. Many organizations express appetite in board-approved statements, such as 'no tolerance for breaches of customer payment data' or 'moderate appetite for innovation risk in new digital services'.
Types of controls
Controls are classified in two dimensions. By category: administrative (or managerial) controls such as policies, training and background checks; technical (or logical) controls such as encryption, firewalls and access control software; and physical controls such as locks, fences and guards. By function: preventive controls stop incidents (locks, access control); detective controls find them (logs, intrusion detection, audits); corrective controls fix problems after detection (restoring from backup, patching); deterrent controls discourage attempts (warning banners, visible cameras); recovery controls restore operations (disaster recovery sites); directive controls tell people what to do (policies, signs); and compensating controls provide alternative protection when a primary control is not feasible.
| Function | Administrative | Technical | Physical |
|---|---|---|---|
| Preventive | Separation of duties | Multi-factor authentication | Locked server room |
| Detective | Access reviews | Intrusion detection system | CCTV monitoring |
| Corrective | Incident response procedures | Restore from backup | Repairing a broken lock |
| Deterrent | Disciplinary policy | Login warning banner | Visible guards |
| Recovery | Continuity plan | Failover to replica | Alternate site |
Assessing controls and monitoring risk
Controls must be tested to confirm they are designed well and operate effectively. Control assessments include self-assessments, internal audits, external audits, vulnerability scans, penetration tests and specific privacy assessments. NIST SP 800-53A provides assessment procedures for SP 800-53 controls. Results feed the risk register: a control that fails testing means residual risk is higher than assumed.
Risk changes constantly, so monitoring must be continuous rather than annual. Continuous monitoring uses automated tools, key risk indicators and periodic reassessment to track changes in threats, vulnerabilities, assets and control effectiveness. Reporting goes both internally, to risk owners, executives and the board, and externally, to regulators, auditors, customers and, for public companies, investors. Continuous improvement uses lessons from incidents, audits and changes to strengthen the program over time, and risk maturity models help measure progress from ad hoc to optimized risk management.
Risk assessment results are only as good as their inputs, so assessors should record their assumptions and sources and revisit estimates when new information arrives. Presenting ranges, such as an ALE between $120,000 and $300,000, is often more honest than a single figure and helps leaders understand uncertainty.
Common mistakes
MistakeForgetting to annualize the rate of occurrence.
InsteadOnce every four years is an ARO of 0.25.
MistakeLeaving the control's cost out of the safeguard value.
InsteadValue equals ALE before minus ALE after minus annual cost.
MistakeThinking insurance transfers accountability.
InsteadInsurance shares financial impact; the organization remains accountable.
MistakeTreating ignoring a risk as acceptance.
InsteadAcceptance is a formal, documented decision by an authorized owner.
MistakeRanking risks only by score.
InsteadConsider catastrophic low-likelihood risks separately, for example through continuity planning.
Summary and key terms
- Risk combines the likelihood that a threat exploits a vulnerability with the impact on an asset.
- A risk register records risks, owners, ratings, controls and treatments.
- Qualitative assessment is quick and subjective; quantitative assessment supports cost-benefit decisions but needs data.
- SLE = AV × EF; ALE = SLE × ARO; safeguard value = ALE before − ALE after − annual cost.
- Responses are mitigate, transfer, avoid and accept; ignoring a risk is not valid.
- Controls are administrative, technical or physical, and preventive, detective, corrective, deterrent, recovery, directive or compensating.
- Controls must be assessed and risks monitored continuously, reported and improved over time.
- Threat
- A potential cause of an unwanted incident.
- Vulnerability
- A weakness that a threat could exploit.
- Residual risk
- The risk remaining after controls are applied.
- Single loss expectancy
- Expected loss from one occurrence: asset value × exposure factor.
- Exposure factor
- Percentage of asset value lost in one occurrence.
- Annualized rate of occurrence
- Expected number of occurrences per year.
- Annualized loss expectancy
- Expected yearly loss: SLE × ARO.
- Risk appetite
- The risk an organization is willing to pursue to meet objectives.
- Compensating control
- An alternative control used when a primary control is not feasible.
- Continuous monitoring
- Ongoing tracking of risks and control effectiveness.
Practice problems
Work each problem on paper first, then reveal the answer to check.
An asset worth $500,000 would lose 20 per cent of its value in an incident. What is the SLE?
Show answer
$100,000.
An event is expected once every 5 years. What is its ARO?
Show answer
0.2.
With SLE $100,000 and ARO 0.2, what is the ALE?
Show answer
$20,000.
A control reduces ALE from $60,000 to $10,000 and costs $30,000 a year. Is it justified?
Show answer
Yes; value is $20,000 a year.
Name the four risk responses.
Show answer
Mitigate, transfer, avoid and accept.
Does cyber insurance transfer accountability?
Show answer
No; it shares financial impact only.
Give an example of a detective technical control.
Show answer
An intrusion detection system or log monitoring.
What is the Delphi method used for?
Show answer
Reaching consensus on estimates through anonymous rounds of expert input.
What is residual risk?
Show answer
Risk remaining after controls are applied.
Which NIST publication gives control assessment procedures?
Show answer
SP 800-53A.
Lesson quiz · 5 questions
Score 60% or more to complete this lesson.
Create a free account to save your progress, take quizzes and earn a certificate.