
AERO-200 · Lesson 12 of 12 · 22 min
The aircraft design process
On the last day of his co-op term, Arjun is asked to present a short talk to the whole engineering team: how would he design a smaller sister aircraft to the Tern, if Borealis Aerospace decided to build one? Élise tells him not to worry about getting the answer right. What she wants to see is whether he understands the process: how requirements become a concept, how a first weight estimate is made, how the wing and powertrain are sized, and how all the disciplines from the earlier lessons come together and iterate. This final lesson walks through that process using the Tern itself as the example.
From requirements to concept
Every design starts with requirements, and getting them right is the most important step. Requirements come from customers, regulations and the company's own strategy. For the Tern they include: nine passengers with baggage; a design range of 750 km with reserves; a cruise speed of at least 350 km/h; take-off and landing on 1000 m runways, including gravel, at Winnipeg's summer temperatures; operating costs at least 25 percent below the aging turboprops it would replace; certification as a normal-category aeroplane; and noise well below current regional aircraft. Some requirements conflict: a short runway wants a big wing; fast, efficient cruise wants a small one.
Engineers turn requirements into a design in three broad phases. Conceptual design explores many possible configurations quickly and chooses one: high wing or low wing, how many engines, where they go, conventional tail or T-tail, retractable or fixed gear. Preliminary design develops the chosen concept in detail, sizing the wing, tail, fuselage and powertrain, estimating weights and performance accurately, and running wind-tunnel tests. Detail design produces the drawings, analyses and specifications for every part, and the manufacturing plans to build them. The cost of changes grows rapidly through these phases, so the most important decisions should be made early, with the best possible information.
Design is iterative, often drawn as a spiral. A first guess at the weight sets the wing area and engine power; those set the drag and fuel or energy needed; the energy storage and structure change the weight; and the loop repeats. Each pass adds detail and accuracy. Trade studies compare alternatives quantitatively: what does a 10 percent bigger wing do to take-off distance, cruise drag, weight and cost? Engineers present the results as carpet plots or sensitivity tables so managers can see the consequences of each choice.
The first weight estimate
Weight drives everything, so conceptual design begins with an estimate of the take-off weight. The classic method splits the weight into three parts: the payload and crew, which are fixed by the requirements; the fuel or energy storage, which depends on the mission and efficiency; and the empty weight, which includes structure, powerplant, systems and equipment. The fuel weight is estimated as a fraction of take-off weight from the Breguet equation, and the empty weight as a fraction from statistical trends of similar aircraft.
Because the empty-weight fraction itself depends on take-off weight (larger aircraft tend to have slightly smaller empty fractions), the equation is solved by iteration: guess \(W_0\), compute the fractions, compute a new \(W_0\), and repeat until it stops changing. The method is crude but powerful, because it captures the snowball effect: adding 1 kg of payload or equipment adds several kilograms of take-off weight once the extra structure, wing and energy needed to carry it are included. For the Tern, with an empty fraction near 0.72 and a fuel fraction of 0.10, every kilogram of payload costs about 5.7 kg of take-off weight.
Worked problem
First sizing of the Tern
The payload is nine passengers at 95 kg each with baggage plus 100 kg of cargo, and the crew is two people at 90 kg. The mission fuel fraction, including take-off, climb, a 750 km cruise and a 6 percent reserve, works out to 0.104 from the Breguet equation. For a hybrid-electric commuter, use the empty-weight fraction \(W_e/W_0 = 1.10\,W_0^{-0.05} + 0.01\), which is higher than for a conventional turboprop because of the batteries and electric drive. Then size the wing for a stall speed of 78 kt (40 m/s) with \(C_{L,\max} = 2.3\).
Show solution
- Fixed weights: payload \(9 \times 95 + 100 = 955\ \text{kg}\); crew 180 kg; total 1135 kg.
- Iterate: starting from 4000 kg, the empty fraction is 0.72 and the new estimate 6427 kg; the next passes settle at about 6430 kg within a few iterations.
- Wing loading from stall speed: \(W/S = \tfrac{1}{2}\rho V_S^2 C_{L,\max} = 0.5 \times 1.225 \times 40^2 \times 2.3 = 2254\ \text{N/m}^2\).
- Wing area: \(S = 6430 \times 9.81/2254 = 28.0\ \text{m}^2\).
Answer: The first estimate of about 6430 kg and 28 m² is close to the values used throughout this course. Arjun points out that the empty-weight trend is the weakest link: if the batteries come in 10 percent heavier than planned, the snowball effect raises take-off weight by much more than the battery mass itself. That is why Borealis Aerospace tracks weight weekly against a budget for every system.
# First weight estimate and a simple constraint check for the Tern
import math
payload = 9 * 95 + 100          # nine passengers with bags plus cargo, kg
crew = 2 * 90
# Empty-weight fraction from a statistical trend for commuter aircraft (illustrative fit)
def empty_fraction(W0): return 1.10 * W0 ** -0.05 + 0.01   # higher than a turboprop: batteries and electric drive
# Fuel fraction from Breguet for a 750 km mission plus reserve
R, LD, eta, sfc = 750e3, 13.0, 0.82, 0.30 / 3.6e6
cruise = math.exp(-R * sfc * 9.81 / (eta * LD))
fuel_frac = 1.06 * (1 - 0.97 * 0.985 * cruise)      # take-off, climb, cruise, 6% reserve
W0 = 4000.0
for i in range(30):
    W0_new = (payload + crew) / (1 - empty_fraction(W0) - fuel_frac)
    if abs(W0_new - W0) < 0.5: break
    W0 = W0_new
print(f"Converged in {i} steps: take-off mass {W0:.0f} kg, empty fraction {empty_fraction(W0):.3f}, fuel fraction {fuel_frac:.3f}")

# Wing loading from stall speed and power loading from cruise speed
rho0, Vs, CLmax = 1.225, 40.0, 2.3
WS_max = 0.5 * rho0 * Vs**2 * CLmax
print(f"Stall speed {Vs*1.94384:.0f} kt with CLmax {CLmax} limits wing loading to {WS_max:.0f} N/m^2 ({WS_max/9.81:.0f} kg/m^2)")
S = W0 * 9.81 / WS_max
print(f"Wing area needed: {S:.1f} m^2")Converged in 6 steps: take-off mass 6427 kg, empty fraction 0.720, fuel fraction 0.104 Stall speed 78 kt with CLmax 2.3 limits wing loading to 2254 N/m^2 (230 kg/m^2) Wing area needed: 28.0 m^2
Constraint analysis: wing loading and power loading
Two numbers summarize an aircraft's sizing: its wing loading \(W/S\) and its power loading \(W/P\) (or thrust-to-weight ratio \(T/W\) for jets). Each requirement sets a limit on these. Stall speed and landing distance set a maximum wing loading, because a heavily loaded wing needs more speed to land. Take-off distance requires enough power for a given wing loading. Climb rate and one-engine-out climb require a minimum power-to-weight ratio. Cruise speed at altitude requires enough power to overcome drag, which depends on both. Plotting all these constraints on one chart of power-to-weight against wing loading shows the region where every requirement is met.
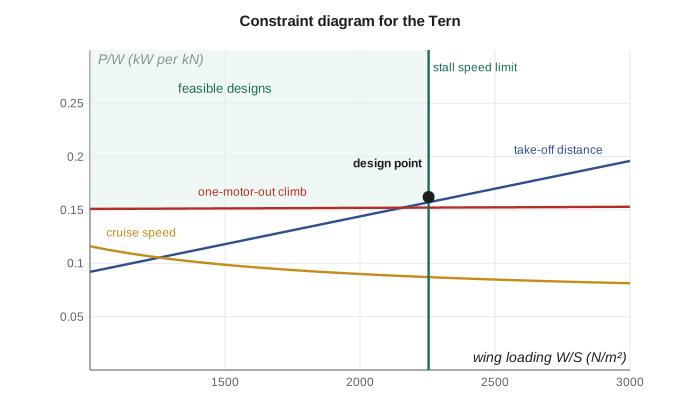
The designer usually chooses a point near the corner of the feasible region: the highest wing loading the stall requirement allows, which gives the smallest, lightest wing, and the lowest power that still meets the take-off, climb and cruise constraints. For the Tern, the constraint diagram shows that the one-engine-out climb and the hot-day take-off set the motor power, and the stall speed sets the wing area. The cruise-speed constraint is easily met. That result told the team early on that battery power, not battery energy, would size the battery for take-off, and the turbine generator could be sized for cruise.
Bringing the disciplines together
With a weight and a design point, each discipline from this course takes its turn. Aerodynamicists choose airfoils and planform (Lessons 3 and 4) and estimate the drag polar. Propulsion engineers size motors, propellers, battery and generator (Lesson 5). Structures engineers lay out the wing box, fuselage frames and landing gear loads (Lesson 6). Stability engineers size the tail and set the centre-of-gravity range (Lesson 7). Performance engineers confirm range, climb, take-off and landing (Lesson 8). Certification engineers check every decision against the certification basis (Lesson 11). Each discipline's results feed back into the others, and the weight estimate is updated.
| Tern design parameter | Value | Main driver |
|---|---|---|
| Take-off mass | 6500 kg | Payload, range and empty-weight fraction |
| Wing area and span | 28 m², 17 m (AR 10.3) | Stall speed; cruise L/D |
| Maximum L/D | about 15 | Aspect ratio and parasite drag |
| Motor power | 2 × 450 kW, with 600 kW contingency rating | One-engine-out climb and hot-day take-off |
| Battery | 1120 kg | Take-off and climb power; short-leg energy |
| Turbine generator | sized for cruise | Cruise power at 3000 m |
| Cruise | 380 km/h at 3000 m | Trip time and operating cost |
| Static margin | 15 to 19 percent MAC | Handling qualities; tail size |
Design reviews mark the transitions between phases. At the conceptual design review, the company commits to a configuration. At the preliminary design review, it freezes the external shape and the main structural arrangement. At the critical design review, the detailed design is judged ready for manufacture. Each review checks requirements, weights, performance, risks, schedule and cost. Many aerospace programmes that run into trouble do so because they moved past a review with unresolved problems, which then surfaced as expensive changes later.
Testing, certification and production
Design is validated by testing at every level, from coupons and components to wind-tunnel models, iron birds (ground rigs that combine the real flight control and powertrain systems) and finally prototypes. The first flight is a milestone, but it is the start of a long flight test campaign, typically hundreds of flights, that explores the envelope, measures performance, checks handling qualities, tests failures such as engine-out and electrical faults, and gathers evidence for certification. Sam's team will fly three Tern prototypes for about two years.
Meanwhile, manufacturing engineers develop tooling, assembly sequences and supply chains, and the quality team prepares for production approval. Customer support develops maintenance manuals, training and spare parts. An aircraft programme succeeds only if all of these work together. A brilliant design that cannot be built at the target cost, certified on schedule, or supported in service does not succeed in the market.
Lessons from history and the engineer's responsibility
The history of aerospace is full of designs that changed the world and of failures that taught hard lessons. The Douglas DC-3 of the 1930s combined a stressed-skin structure, retractable gear, flaps and efficient engines to make airline travel profitable. The Comet introduced jet travel and then taught the industry about fatigue. The Concorde showed that supersonic airliners were possible but not economical. The 737 MAX accidents showed how a design change, inadequate assessment of a single sensor input and gaps in pilot information and oversight could combine with deadly results. Each of these stories is worth studying as an engineer.
The common thread is that aircraft are systems in which every part affects the others, and in which the consequences of mistakes can be fatal. Aerospace engineers carry a serious professional responsibility: to analyse carefully, test honestly, report problems openly and resist pressure to cut corners. Arjun ends his talk with a sentence he heard from Marcus on his first day: \"Every number in a stress report is a promise to someone you will never meet.\" Élise tells him it was the best part of the presentation.
Common mistakes
MistakeStarting detailed design before the requirements are agreed.
InsteadRequirements drive everything; changes are cheap early and very expensive late.
MistakeEstimating take-off weight by adding up guessed component weights.
InsteadUse the weight-fraction method with fuel fractions from the mission and empty fractions from similar aircraft, then iterate.
MistakeIgnoring the snowball effect of added weight.
InsteadEach kilogram added requires extra structure, wing and energy; take-off weight grows several times faster than the item's weight.
MistakeOptimizing one discipline in isolation.
InsteadA wing that is aerodynamically ideal may be too heavy or too flexible; design is a balance across disciplines.
MistakeTreating first flight as the end of the design work.
InsteadFlight testing, certification, production and support are long, expensive phases that often reveal design changes.
Summary and key terms
- Design begins with requirements from customers, regulations and strategy; some requirements conflict and must be traded.
- Conceptual, preliminary and detail design add detail in successive passes around the design spiral.
- Take-off weight is first estimated from payload, mission fuel fraction and statistical empty-weight fractions, solved iteratively.
- The snowball effect makes every added kilogram cost several kilograms of take-off weight.
- Constraint diagrams of power-to-weight against wing loading show which requirements size the wing and powertrain.
- All disciplines iterate together; design reviews, testing, certification, production and support complete the programme, and engineers carry a serious responsibility for safety.
- Requirement
- A statement of what the aircraft must do, set by customers, regulations or the company.
- Conceptual design
- The phase in which many configurations are explored and one is chosen.
- Preliminary design
- The phase in which the chosen concept is sized and analysed in detail.
- Detail design
- The phase producing drawings, analyses and specifications for every part.
- Design spiral
- The iterative process of revisiting each discipline with increasing detail.
- Trade study
- A quantitative comparison of design alternatives.
- Empty-weight fraction
- Empty weight divided by take-off weight.
- Snowball effect
- The growth of take-off weight by several times any added weight, through the extra structure and energy needed to carry it.
- Wing loading
- Aircraft weight divided by wing area, W/S.
- Constraint diagram
- A plot of power-to-weight or thrust-to-weight against wing loading showing the limits set by each requirement.
- Iron bird
- A ground test rig combining an aircraft's real control and power systems.
Practice problems
Work each problem on paper first, then reveal the answer to check.
Name three phases of aircraft design and what each produces.
Show answer
Conceptual design (a chosen configuration and rough size), preliminary design (sized, analysed design with frozen external shape), detail design (drawings and specifications for every part).
Payload plus crew is 1000 kg, the empty fraction is 0.60 and the fuel fraction is 0.15. Find the take-off weight.
Show answer
W₀ = 1000/(1 − 0.60 − 0.15) = 4000 kg.
In the previous question, how much does take-off weight grow if payload rises by 100 kg?
Show answer
To 4400 kg: each kilogram of payload costs 4 kg of take-off weight.
Find the wing loading allowed by a stall speed of 30 m/s with C_L,max = 1.8 at sea level.
Show answer
W/S = ½(1.225)(900)(1.8) = 992 N/m².
On a constraint diagram, why is the design point usually chosen near a corner of the feasible region?
Show answer
It gives the highest allowable wing loading (smallest wing) with the lowest power that still meets every requirement, minimizing weight and cost.
In the program, change the design range to 1000 km. What happens to the take-off mass?
Show answer
The fuel fraction rises to about 0.122 and the take-off mass to about 7020 kg, and the wing area needed grows to about 30.6 m²: the snowball effect at work.
Lesson quiz · 5 questions
Score 60% or more to complete this lesson.
Create a free account to save your progress, take quizzes and earn a certificate.