
SLS-214 · Lesson 11 of 12 · 21 min
Sales dashboards
▶ Video coming soon A video version of this lesson is on the way.
Every Monday morning, Darnell opened the same screen in the CRM before he opened his email: the team dashboard. On November 6, Grace asked Maya to design her own. "You've learned to calculate the numbers," Grace said. "A dashboard is where you decide which few of them you look at every week, and how they're shown so that you notice what matters in a few seconds."
A sales dashboard is a single screen of charts and figures that summarizes sales performance, updated automatically from the CRM or a spreadsheet. A good dashboard answers a small set of questions for a particular person, quickly and without explanation. A bad one shows everything the system can produce, which means nobody notices anything.
Start with the audience
Different people need different dashboards, because they make different decisions.
| Audience | Decisions they make | What their dashboard shows |
|---|---|---|
| Seller | Where to spend this week | Own attainment, pipeline coverage for next quarter, activity against plan, deals needing action |
| Sales manager | Whom to coach and which deals to inspect | Attainment and coverage by seller, conversion by stage, slipped deals, discounts, forecast categories |
| Executive | Whether the plan is on track and what to tell the owners | Bookings against plan, forecast range, trends by quarter, major risks |
The test of a dashboard is whether it leads to action. For each figure, Grace asked: "If this number changed, what would the person looking at it do differently?" If the answer was nothing, the figure did not belong on the dashboard, however interesting it was.
Maya's dashboard
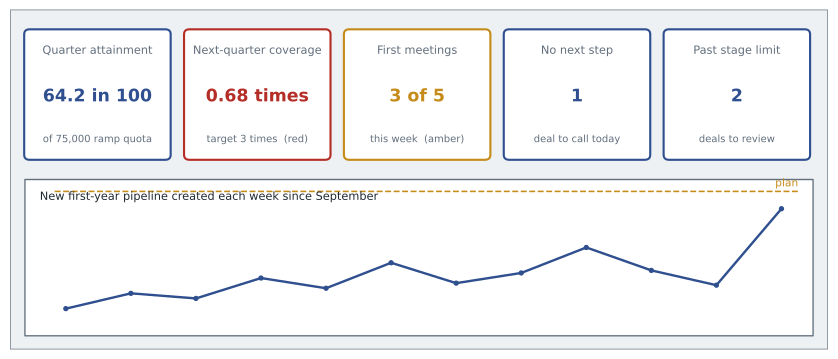
Maya chose five tiles for her own weekly dashboard, each tied to a decision.
| Tile | Value on November 13 | What it prompts |
|---|---|---|
| Quarter attainment | 48,172 of 75,000 dollars, about 64.2 in 100 | Whether to chase anything else that can close by November 30 |
| Next-quarter coverage | 102,040 of 150,000 dollars, about 0.68 times | How much prospecting to do this week |
| First meetings this week | 3 against a plan of 5 | Whether to block more calling time |
| Deals with no next step | 1 | Which customer to call today |
| Deals past their stage limit | 2 | Which deals to review with Darnell |
Three of the five tiles are leading indicators, because those are the ones she could still change. Her quarter attainment was nearly settled; her coverage for December to February was not.
Design principles
Grace's design rules came from experience and from the wider practice of data visualization, where writers such as Stephen Few and Edward Tufte have argued for clarity over decoration.
| Principle | In practice |
|---|---|
| Few things, well chosen | Five to nine figures on one screen, without scrolling |
| Most important at top left | People read screens in that order |
| Compare with something | Show every number against a target, last period or the team: 64.2 in 100 of quota, not just 48,172 dollars |
| Use color sparingly and for meaning | Gray for most things; one highlight color, or red, amber and green for status |
| Choose the chart for the question | Bars to compare, lines for trends, stacked bars for parts of a total |
| Label clearly | Units, periods and a title that states the point |
| Show freshness | When the data was last updated |
| Allow drill-down | Click a tile to see the deals behind it |
The comparison principle matters most. A figure on its own, such as 512,000 dollars of fourth-quarter bookings, means little. Against a quarterly quota of 750,000, against the 964,000 needed for the year, or against last year's fourth quarter of 772,000, it tells a story.
Status colors and thresholds
Many dashboards show status with color: green for on track, amber for at risk, red for off track. Color works only if the thresholds are defined in advance and the same everywhere.
Worked problem
Setting coverage thresholds
Ridgeline's coverage target is 3 times quota. Grace sets green at 3 times or more, amber from 2 times up to 3, and red below 2. What color does each of these sellers' next-quarter coverage show: Kevin 3.4, Lisa 2.6, Maya 0.68, Andrew 1.9?
Show solution
- Kevin: 3.4 is at least 3, so green.
- Lisa: 2.6 is between 2 and 3, so amber.
- Maya: 0.68 is below 2, so red.
- Andrew: 1.9 is below 2, so red.
Answer: Kevin is green, Lisa amber, and Maya and Andrew red. Maya's red is expected for a new seller and is addressed by her prospecting plan; Andrew's is a coaching conversation.
Two cautions came with color. About 1 in 12 men and a much smaller share of women have some form of color vision deficiency, most often difficulty telling red from green, so status should also be shown by a symbol, a label or position. And thresholds must reflect context: Maya's red coverage meant something different from Andrew's, which is why Grace always put a short note beside red tiles.
The manager's dashboard
Darnell's dashboard compared sellers. Its main chart was a table of the five established account executives plus Maya, with attainment, next-quarter coverage, win rate over the last twelve months, average discount and the number of slipped deals for each.
| Seller | Quarter attainment | Next-quarter coverage | Twelve-month win rate | Average discount | Slipped deals |
|---|---|---|---|---|---|
| Kevin | On track | 3.4 | 30 in 100 | 5.1 in 100 | 1 |
| Lisa | On track | 2.6 | 27 in 100 | 6.8 in 100 | 2 |
| Nadia | At risk | 2.2 | 24 in 100 | 7.9 in 100 | 3 |
| Andrew | At risk | 1.9 | 19 in 100 | 9.6 in 100 | 4 |
| Sam | Off track | 2.4 | 22 in 100 | 7.2 in 100 | 2 |
| Maya (ramp) | At risk | 0.68 | Too few deals | 3.0 in 100 | 0 |
Reading the table, Darnell saw that Andrew combined the lowest win rate, the highest discount and the most slipped deals, which fitted the late-stage losses found in lesson 3: deals that were not well qualified were being pushed forward and then discounted to close. That pattern is visible in one glance at a well-designed table and almost invisible in five separate reports. The team's average discount, 7.4 in 100 from SLS-213, sat at the top of the dashboard as a reminder of the 2027 discount policy.
The executive dashboard
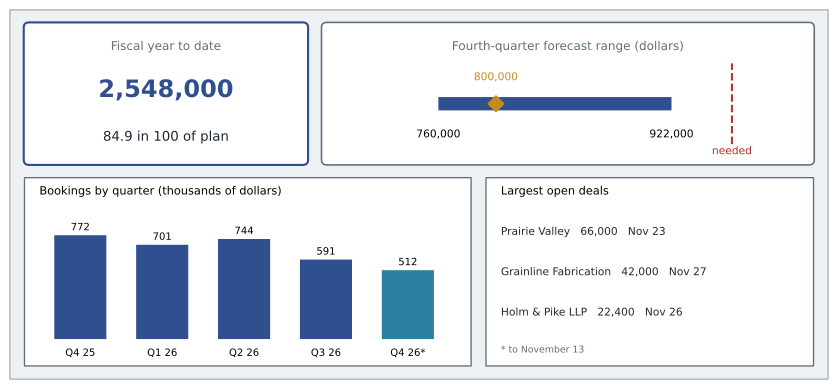
Rob's dashboard was simpler still. It showed fiscal-year bookings against plan, the fourth-quarter forecast range from lesson 8, bookings by quarter for the last two years, and the three largest open deals.
Worked problem
Fiscal year to date
By November 13, Ridgeline's team has booked 2,036,000 dollars in the first three quarters and 512,000 dollars so far in the fourth. What share of the 3,000,000-dollar annual quota is booked, and how does that compare with the share of the year that has passed? November 13 is day 348 of the 365-day fiscal year.
Show solution
- Bookings to date.
- \[2{,}036{,}000 + 512{,}000 = 2{,}548{,}000\]
- \[\frac{2{,}548{,}000}{3{,}000{,}000} \approx 0.849\]
- Share of the year passed.
- \[\frac{348}{365} \approx 0.953\]
Answer: About 84.9 in 100 of the annual quota is booked with about 95.3 in 100 of the year gone. The forecast range in lesson 8 shows how much of the gap the last seventeen days might close.
Common dashboard mistakes
Grace kept a list of dashboard problems she had seen at Ridgeline and elsewhere. Too many tiles, so nothing stands out. Figures without comparisons. Charts chosen for appearance, such as dials and three-dimensional pies, which are harder to read than a simple bar. Inconsistent definitions, where the win rate on one dashboard is overall and on another competitive. Stale data, where a dashboard updated monthly is used for weekly decisions. And dashboards nobody opens, because they were built for a meeting that no longer happens.
The last problem is the most common. Dashboards need owners. Grace reviewed Ridgeline's dashboards every quarter with the people who used them, removed tiles nobody acted on and added ones that new questions needed. Rob's executive dashboard had been cut from fourteen tiles to six the previous spring.
Dashboards and data quality
A dashboard makes data quality visible to everyone, which is uncomfortable but useful. When the tile showing deals with no next step jumped from 2 to 19 on the team dashboard in October, it was not that sellers had suddenly stopped planning; a CRM update had cleared a field. The dashboard exposed the problem the same morning. Grace added a small data-quality panel to Darnell's dashboard: duplicate accounts, opportunities missing a close date and deals with an amount of zero, using the measures from the clean-up in SLS-140.
Dashboards are also only as fair as their definitions. Before any number appeared on a dashboard, Grace wrote its definition in a shared glossary: what was counted, from which field, over which period. That made the arguments about whose win rate was right, from lesson 5, much shorter.
Choosing the right chart
Most dashboard tiles use one of a few chart types, and choosing the right one is the single biggest design decision. Bar charts compare quantities across categories, such as attainment by seller; horizontal bars work better than vertical ones when the category names are long. Line charts show change over time, such as monthly bookings or weekly new pipeline. Stacked bars show how a total is made up, such as closed plus weighted pipeline. Tables are often the best choice for managers, because they show several measures for each person at once, as Darnell's seller comparison did. A single large number with a comparison beside it, such as 64.2 in 100 of quota, is the clearest tile of all.
Some chart types are best avoided. Gauges and dials take up a lot of space to show one number and make comparisons hard. Pie charts become unreadable with more than a few slices, and people judge angles less accurately than lengths. Three-dimensional effects distort the sizes they are meant to show. Grace's test was simple: if a person had to study a chart for more than a few seconds to answer its question, it was the wrong chart.
Funnel and trend views
Two views appeared on almost every sales dashboard Grace built. The first was a funnel, like the one in lesson 3, showing how many opportunities were at each stage and the conversion between them. The second was a trend of new pipeline created per week, because it was the earliest warning of a future shortfall. If new pipeline fell for three or four weeks in a row, the quarter after next was at risk, months before any bookings figure would show it.
Worked problem
Reading a trend tile
Maya's new first-year pipeline created in the last four weeks was 14,000, 9,500, 6,600 and 21,600 dollars. Her plan calls for about 25,000 dollars a week to reach 3 times coverage by the start of each quarter. What is her four-week average, and what share of plan is it?
Show solution
- \[\frac{14{,}000 + 9{,}500 + 6{,}600 + 21{,}600}{4} = \frac{51{,}700}{4} = 12{,}925\]
- \[\frac{12{,}925}{25{,}000} \approx 0.52\]
Answer: Her four-week average is 12,925 dollars a week, about 52 in 100 of plan. The tile should show amber or red with the plan line beside it, which is the prompt for more prospecting time.
Grace's final advice on dashboards was to show them to their users before finishing them. She sat with Maya for ten minutes while Maya looked at a draft and said aloud what she noticed first and what she would do. Two tiles that Grace thought were obvious turned out to be confusing, and one that Maya wanted, the number of days until each open deal's expected close, was missing. Watching a real user is the quickest way to find out whether a dashboard works.
Common mistakes
MistakePutting every available metric on the dashboard.
InsteadChoose five to nine figures, each tied to a decision.
MistakeShowing numbers without targets or comparisons.
InsteadShow every figure against a target, last period or the team.
MistakeRelying on red and green alone.
InsteadAdd symbols or labels, and define thresholds in advance.
MistakeUsing decorative charts such as dials and three-dimensional pies.
InsteadUse bars to compare and lines for trends.
MistakeBuilding a dashboard and never reviewing it.
InsteadGive each dashboard an owner and review it with its users each quarter.
Summary and key terms
- A sales dashboard is one screen that answers a few questions for a particular audience: sellers decide where to spend the week, managers whom to coach, executives whether the plan is on track.
- Every figure should prompt an action.
- Maya's five tiles were mostly leading indicators: quarter attainment about 64.2 in 100, next-quarter coverage about 0.68 times, meetings against plan, deals with no next step and deals past their stage limit.
- Good design shows few figures, compares each with a target, uses color sparingly with predefined thresholds and a non-color cue, picks charts for the question, labels clearly and shows freshness.
- Darnell's seller table revealed Andrew's pattern at a glance.
- The team had booked about 84.9 in 100 of its quota with about 95.3 in 100 of the year gone.
- Sales dashboard
- A single screen of figures and charts that summarizes sales performance and updates automatically.
- Tile
- One figure or small chart on a dashboard.
- Threshold
- A predefined value at which a status changes, such as from amber to red.
- Drill-down
- Clicking a dashboard figure to see the records behind it.
- Data freshness
- How recently the data behind a dashboard was updated.
- Status color
- Color used to show whether a figure is on track, at risk or off track.
Practice problems
Work each problem on paper first, then reveal the answer to check.
A tile shows 36,000 dollars booked against a quarterly quota of 60,000. What should it display as attainment?
Show answer
36,000 ÷ 60,000 = 0.60, or 60 in 100.
With green at 3 times or more, amber from 2 to 3 and red below 2, what color is coverage of 2.0?
Show answer
Amber, because 2.0 is in the range from 2 up to 3.
Why should a dashboard show when its data was last updated?
Show answer
So users know whether it is current enough for the decision they are making.
Lesson quiz · 5 questions
Score 60% or more to complete this lesson.
Create a free account to save your progress, take quizzes and earn a certificate.