
RAC-230 · Lesson 11 of 12 · 17 min
Trending, alarms and commissioning
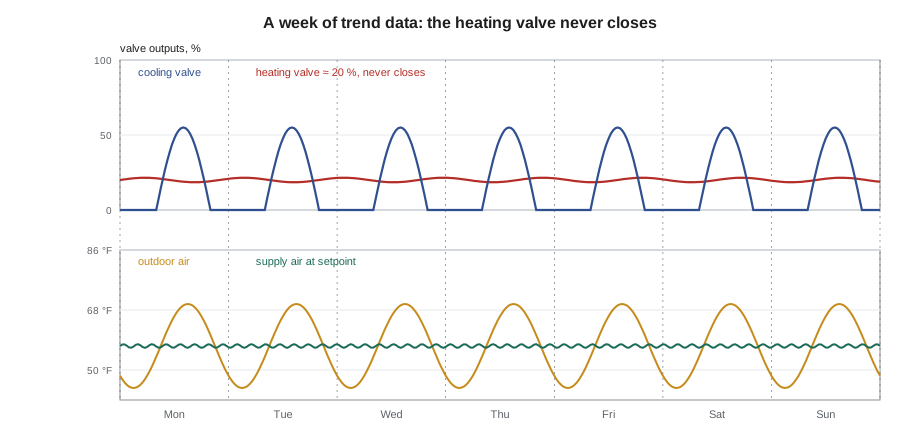
With the overrides cleaned up in lesson 9 and the network fixed in lesson 10, Wes asked the obvious question: how would he know if things went wrong again? Raj's answer was trends. He set up trend logs on the residence's air handlers, its glycol chiller plant and the new walk-ins, sampling every five minutes, and came back with Theo a week later to read them. On the second-floor air handler, the graphs showed something no single screen had: the heating valve sat at about 20 % open all week, even on warm afternoons, while the chilled-glycol valve worked hard beside it. "The air handler was heating and cooling the same air at the same time," Raj said. "Nobody would have seen it on a graphic. You see it on a trend."
This lesson covers how to collect and read trend data, how automated fault detection uses it, how to manage alarms so that people respond to them, and how commissioning proves that systems work as designed when they are new and keep working afterward. These skills turn a building automation system from a remote control into a diagnostic tool.
Trend logs
A trend log records the value of a point over time. Interval trends sample at a fixed rate, such as every minute or every fifteen minutes; change-of-value trends record a new sample only when the value changes by more than a set amount, or when a binary point changes state. The right sample rate depends on what you want to see. Short cycling and hunting loops need samples every minute or faster; energy use and schedule problems show up in fifteen-minute data. Controllers hold limited trend memory, so supervisory controllers or servers usually collect and store the data for longer periods.
- Trend related points together: setpoint, measured value and output of each loop, and command and status of each fan or pump.
- Include outdoor temperature and humidity, which explain much of what equipment does.
- Check that the controller's clock and time zone are correct, including daylight saving changes.
- Keep raw data rather than only daily averages, which hide cycling and hunting.
Reading trends
Most equipment faults have a recognizable signature in trend data. Learning the common signatures turns hours of graphs into a few minutes of checking.
| Pattern in the trend | What it usually means |
|---|---|
| Heating and cooling outputs both above zero for long periods | Simultaneous heating and cooling: a leaking valve, a bad sensor or overlapping setpoints |
| Output pinned at 100 % with the measured value far from setpoint | Undersized capacity, a failed device downstream or a valve that does not respond |
| Measured value oscillating around setpoint | Loop tuning, a sticking actuator or a poorly placed sensor (lesson 1) |
| Compressor or fan status changing many times per hour | Short cycling (lessons 1 and 4) |
| Mixed air temperature outside the range between return and outdoor air | A faulty sensor or stratification |
| Equipment running outside occupied hours | A schedule error or forgotten override (lesson 9) |
| Economizer closed on cool, dry days with cooling running | A damper, linkage, sensor or changeover fault (lesson 8) |
| A sensor that never changes | A failed sensor or a stale value from an offline controller |
Automated fault detection
Reading trends by eye works for one building, but owners with many buildings use fault detection and diagnostics software that applies rules to the data automatically. Many of the rules come from published research on air handler and rooftop unit performance and are simple to state: if the heating and cooling valves are both open by more than a few percent for more than an hour, flag simultaneous heating and cooling; if the mixed air temperature is outside the range between return and outdoor air by more than a sensor tolerance, flag a sensor fault; if the supply fan runs outside occupied hours, flag the schedule. The software ranks faults by their energy cost or comfort impact. The rules are only as good as the data, so sensor checks and correct point mapping come first.
# Simple fault rules applied to hourly trend data from an air handler (values are illustrative)
rows = [  # hour, outdoor, return, mixed, supply, heat valve %, cool valve %, fan status, occupied
    (6, 48.0, 73.0, 69.0, 57.0, 22, 0, 1, 1), (9, 57.0, 73.0, 71.0, 57.0, 21, 18, 1, 1), (12, 68.0, 73.0, 72.3, 57.0, 20, 46, 1, 1),
    (15, 75.0, 73.0, 80.0, 57.0, 20, 58, 1, 1), (18, 70.0, 73.0, 72.6, 57.0, 21, 35, 1, 1), (23, 55.0, 73.0, 71.6, 70.0, 0, 0, 1, 0),
]
TOL = 2.0
faults = []
for h, oat, rat, mat, sat, hv, cv, fan, occ in rows:
    if hv > 5 and cv > 5:
        faults.append((h, f"simultaneous heating ({hv} %) and cooling ({cv} %)"))
    lo, hi = min(oat, rat) - TOL, max(oat, rat) + TOL
    if not lo <= mat <= hi:
        faults.append((h, f"mixed air {mat} outside the range {min(oat, rat)} to {max(oat, rat)}: check the mixed air sensor"))
    if fan and not occ:
        faults.append((h, "supply fan running while unoccupied: check the schedule and overrides"))
for h, text in faults:
    print(f"{h:02d}:00  {text}")
print(f"{len(faults)} flags from {len(rows)} rows")09:00 simultaneous heating (21 %) and cooling (18 %) 12:00 simultaneous heating (20 %) and cooling (46 %) 15:00 simultaneous heating (20 %) and cooling (58 %) 15:00 mixed air 80.0 outside the range 73.0 to 75.0: check the mixed air sensor 18:00 simultaneous heating (21 %) and cooling (35 %) 23:00 supply fan running while unoccupied: check the schedule and overrides 6 flags from 6 rows
The rules flagged three different problems in one day of data, which matches what Raj and Theo found. The heating valve on the second-floor air handler was leaking through: its actuator was commanded to 0 % at night, but during the day a minimum heating output had been programd into the reheat logic years earlier, and the valve seat was worn so even at 0 % it passed hot water. The mixed air sensor read high in the afternoon because it was a single-point sensor in the top of the mixing box, where warm return air stratified. And the fan running at 23:00 was a second forgotten schedule exception from a holiday the previous year.
Alarm management
A building automation system can generate thousands of alarms, and an alarm console full of old, unacknowledged events is worse than useless, because the important alarm is lost in the noise. Good alarm management is a design task as much as a setting.
- Every alarm should require an action. If nobody would do anything, it should be an event in a log, not an alarm.
- Priorities should reflect consequences: a walk-in freezer warming or a chiller tripping is urgent; a filter needing changing is not.
- Delays and conditions should suppress alarms that are expected, such as high temperature after a defrost or a fan status alarm while the fan is commanded off.
- Routing should send each alarm to someone who can act: the maintenance office during the day, an on-call phone at night, the service company for refrigeration.
- Acknowledgment and return-to-normal should be recorded, so the alarm history shows response times.
- Alarms that repeat often should be reviewed and fixed at the cause, as the residence's daily fan failure alarm should have been.
Commissioning
Commissioning is a quality process that verifies systems are designed, installed, tested and documented to meet the owner's requirements, and that the people operating them know how. It is defined in guidelines and standards in both countries, including ASHRAE Guideline 0 and ASHRAE Standard 202, and many energy codes and green building programs require it for larger buildings. Commissioning starts in design, but the parts a technician meets most are the field checks.
- Owner's project requirements and basis of design: what the systems must do and how the designer intends them to do it.
- Pre-functional checklists: installation checks for each piece of equipment, such as rotation, labeling, sensor locations and wiring.
- Point-to-point checkout: proving that every BAS point is wired to the right device, reads correctly and commands the right equipment, in the right direction.
- Functional performance tests: written tests that put each system through every mode in its sequence, including failures, and record whether it responds as specified.
- Issues log: every problem found, who is responsible and when it was resolved.
- Systems manual and training: documentation and instruction for the operators.
- Seasonal and deferred testing: tests that can only be done in heating or cooling season.
Retro-commissioning applies the same process to an existing building that was never commissioned, or whose systems have drifted. Ongoing or monitoring-based commissioning uses trends and fault detection continuously, so drift is caught early, which is exactly what Wes wanted.
Writing and running a functional test
A functional test is a script: initial conditions, an action, the expected response and a space to record the actual response. For the residence's walk-in freezer, Theo wrote a short one for Wes's records based on the controller setup in lesson 6. Each step stated what to do, what should happen and how long it should take.
| Step | Action | Expected response |
|---|---|---|
| 1 | Hold the door open | Fans stop at once; door alarm at the BAS after the set delay |
| 2 | Close the door | Fans restart; alarm returns to normal |
| 3 | Force a defrost | Solenoid closes, compressor stops, heaters on, fans off; ends on coil temperature |
| 4 | Watch recovery | Drip time, then refrigeration; fans start after the coil is cold; no high alarm during the hold |
| 5 | Disconnect the box probe | Probe failure alarm at the BAS within a minute |
| 6 | Warm the box probe above the high limit | High alarm at the BAS after the set delay |
| 7 | Restore everything | All alarms return to normal; record final parameters |
When Theo ran the test with Wes watching, step 6 failed: the high alarm reached the controller's display but not the maintenance office. The BAS integrator had mapped the controller's alarm register but not linked it to the residence's alarm routing. Theo logged it as an issue, Anika fixed the routing remotely the next day, and Theo repeated step 6 on his next visit before marking it closed.
Trends during service calls
Trends are not only for commissioning agents and energy managers. On an ordinary service call, a few minutes with the trends can show when a problem started, what changed at the same time and whether the fault is constant or intermittent. A rooftop unit that trips its high-pressure control only on hot afternoons, a walk-in that warms only after deliveries or a chiller that short cycles only at light load all have patterns that a single visit may never see. When the equipment has no trend capability, a portable data logger left on site for a few days does the same job: clip temperature loggers to the supply air, suction line or box, and a current logger on the compressor lead, then download the data at the next visit. After a repair, a short trend proves the fix far better than a single reading.
Energy and the value of trends
Trends also put a value on faults. Simultaneous heating and cooling, equipment running all night and economizers that never open waste energy every hour they continue, and the cost adds up quickly over a year. An owner who sees that a leaking heating valve cost more than the valve itself is far more willing to approve the repair, and a contractor who can show the before and after trends builds trust. Many utilities and energy programs in both countries also offer incentives for retro-commissioning and monitoring, which can pay for much of the work. For the residence, Raj's report to Wes listed each fault, its likely yearly cost in rough terms and the fix, ranked by payback.
Common mistakes
MistakeTrending only the measured value of a loop.
InsteadTrend the setpoint, measured value and output together.
MistakeSampling every fifteen minutes to look for short cycling.
InsteadUse one-minute or change-of-value trends for fast events.
MistakeLetting nuisance alarms accumulate.
InsteadFix their causes or change them to logged events.
MistakeTreating commissioning as a single start-up visit.
InsteadFollow the process through functional tests, issue resolution, training and seasonal tests.
MistakeMarking a failed test step as complete once the fix is promised.
InsteadRepeat the step after the fix and record the result.
Summary and key terms
- Trend logs record points over time; choose the sample rate for what you want to see.
- Common faults have recognizable trend signatures, such as simultaneous heating and cooling.
- Fault detection software applies simple rules to trend data, but depends on good sensors and mapping.
- Alarms must require action, be prioritized and routed, and be fixed at the cause when they repeat.
- Commissioning verifies systems through checklists, point-to-point checkout, functional tests and documentation.
- Ongoing commissioning uses trends to catch drift after handover.
- Trend log
- A record of a point's value over time.
- Change-of-value trend
- A trend that records a sample only when the value changes by a set amount.
- Simultaneous heating and cooling
- Heating and cooling the same air or water at the same time, wasting energy.
- Alarm routing
- Sending each alarm to the people or devices that can act on it.
- Commissioning
- A quality process that verifies systems meet the owner's requirements.
- Point-to-point checkout
- Proving each BAS point is connected and working correctly.
- Functional performance test
- A written test that puts a system through its sequence and records the results.
- Retro-commissioning
- Commissioning an existing building whose systems were never commissioned or have drifted.
Practice problems
Work each problem on paper first, then reveal the answer to check.
A trend shows a compressor status changing 14 times in an hour. What should be investigated?
Show answer
Short cycling: control differentials, minimum off times, safeties and charge.
Return air is 73 °F, outdoor air 48 °F and mixed air reads 77 °F. What does that suggest?
Show answer
A faulty or poorly placed mixed air sensor.
An alarm occurs every day and nobody acts on it. What should be done?
Show answer
Find and fix its cause, or change it to a logged event if no action is ever needed.
What is a point-to-point checkout?
Show answer
Proving every point is wired to the right device and reads or commands correctly.
Lesson quiz · 5 questions
Score 60% or more to complete this lesson.
Create a free account to save your progress, take quizzes and earn a certificate.