
RAC-110 · Lesson 9 of 12 · 20 min
Pressure-enthalpy diagrams and plotting the cycle
Before the glycol chiller went to the brewery, Dana spread a large chart on the shop bench: a curved dome on a grid, crossed by sloping lines, with the refrigerant name in the corner. "This is the map," she said. "Every state the refrigerant can be in is a point on this chart, and the whole cycle is a shape you can draw with four points and a ruler. Engineers use it to design systems. Technicians use it to understand what the gauges are telling them. Once you can draw the cycle on this, you will never forget how it works."
This lesson introduces enthalpy and the pressure-enthalpy diagram, shows how to plot the vapor-compression cycle on it, and uses the plot to calculate the refrigerating effect, the work of compression, the heat rejected and the coefficient of performance.
Enthalpy
Enthalpy is the total heat content of a substance per unit mass, measured from an agreed reference point. It includes both its sensible heat and any latent heat it holds. When refrigerant flows through a component, the change in its enthalpy is the heat added or removed in that component, plus any work done on it. That makes enthalpy the natural way to keep the books on a refrigeration cycle: subtract the enthalpy entering a component from the enthalpy leaving it, and you have the energy that component moved, per kilogram or per pound of refrigerant.
In US units, enthalpy is given in Btu per pound (Btu/lb). The reference point is a convention: the charts used in North America set the enthalpy of saturated liquid at −40 °F to zero, while most SI charts set the enthalpy of saturated liquid at 0 °C to 200 kJ/kg. Because only differences in enthalpy are ever used, the reference does not matter, as long as all values come from the same chart or table.
The pressure-enthalpy diagram
A pressure-enthalpy diagram, or P-h diagram, plots absolute pressure on the vertical axis and enthalpy on the horizontal axis. The pressure scale is logarithmic, which spreads out the low pressures where evaporators work and compresses the high ones. Each refrigerant has its own diagram, because each has its own properties.
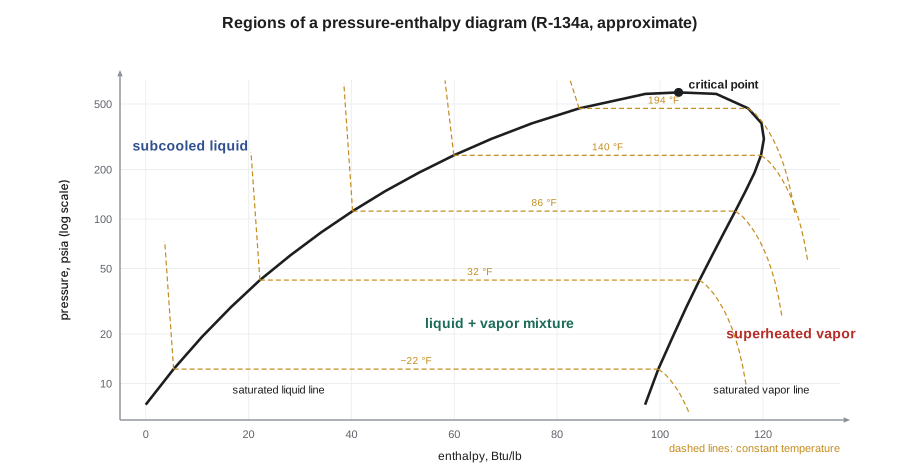
The most important feature is the saturation curve, a dome-shaped line. Its left side is the saturated liquid line: liquid at its boiling point. Its right side is the saturated vapor line: vapor at its condensing point. They meet at the top, at the critical point. The diagram has three regions. To the left of the dome is subcooled liquid. Under the dome is a mixture of liquid and vapor, where a refrigerant is boiling or condensing. To the right of the dome is superheated vapor.
Several families of lines cross the chart. Lines of constant pressure are horizontal. Lines of constant temperature, the isotherms, run horizontally across the dome, because boiling happens at constant pressure and temperature; in the liquid region they fall almost straight down, and in the vapor region they slope down to the right. Under the dome, lines of constant quality show the fraction of the mixture that is vapor, from 0 on the liquid line to 1 on the vapor line. In the vapor region, lines of constant entropy slope steeply up to the right; these are the paths of ideal compression. Lines of constant specific volume, or density, show how thin the vapor is, which sets how much a compressor can move.
Moving horizontally across the dome from the liquid line to the vapor line at one pressure, the enthalpy increases by the latent heat of vaporization at that pressure. The dome is wide at low pressures and narrows toward the top: latent heat shrinks as pressure rises, and it falls to zero at the critical point. That is one reason the cycle becomes less efficient as the condensing temperature rises.
Plotting the cycle
To plot a cycle, you need the evaporating and condensing pressures or temperatures, the superheat at the compressor inlet and the subcooling at the metering device. For the brewery's glycol chiller on a design day, with R-134a: evaporating at 14 °F (about 29.1 psia), condensing at 104 °F (about 147.5 psia), 9 °F of superheat and 9 °F of subcooling. The four points go on the chart as follows.
- Point 1, compressor inlet: on the evaporating pressure line, to the right of the vapor line, where the isotherm for 23 °F (9 °F of superheat) crosses it.
- Point 2, compressor outlet: on the condensing pressure line. For ideal compression, follow the constant-entropy line up from point 1 to the condensing pressure. A real compressor adds more energy than the ideal, so the real point 2 sits further to the right on the same pressure line.
- Point 3, condenser outlet: on the condensing pressure line, to the left of the liquid line, where the isotherm for 95 °F (9 °F of subcooling) crosses it.
- Point 4, evaporator inlet: straight down from point 3 to the evaporating pressure line. The metering device drops the pressure without adding or removing heat, so the enthalpy does not change, and the line from 3 to 4 is vertical. Point 4 falls under the dome, in the mixture region, and the quality lines show how much of the refrigerant has flashed to vapor.
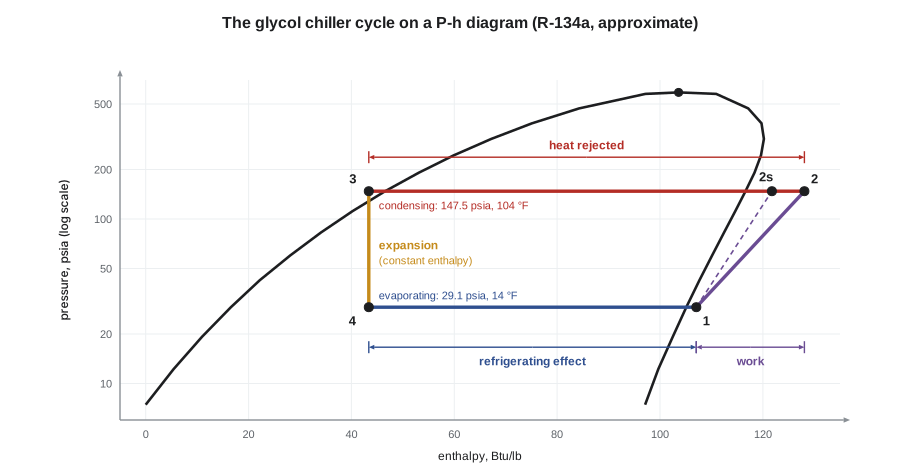
| Point | Location | Pressure, psia | Temperature, °F | Enthalpy, Btu/lb (approx.) |
|---|---|---|---|---|
| 1 | Compressor inlet | 29.1 | 23 (9 °F superheat) | 107.1 |
| 2s | Compressor outlet, ideal | 147.5 | about 122 | 121.8 |
| 2 | Compressor outlet, real (70 % isentropic efficiency) | 147.5 | about 147 | 128.1 |
| 3 | Condenser outlet | 147.5 | 95 (9 °F subcooling) | 43.4 |
| 4 | Evaporator inlet | 29.1 | 14 (quality about 0.30) | 43.4 |
Reading energy from the plot
Once the cycle is plotted, the energy in each process is a horizontal distance on the chart, read on the enthalpy scale. The refrigerating effect is the length of the evaporator line, from point 4 to point 1. The work of compression per unit mass is the length from point 1 to point 2. The heat rejected in the condenser is the length from point 2 back to point 3. Because 3 and 4 have the same enthalpy, the heat rejected is exactly the refrigerating effect plus the work, which is the energy balance from Lesson 1 drawn on a chart.
Worked problem
The glycol chiller's cycle
Using the table above, find the refrigerating effect, the work of compression, the heat rejected and the coefficient of performance for the real compressor, and compare the COP with the ideal compressor.
Show solution
- \[q_{\text{RE}} = 107.1 - 43.4 = 63.7\ \text{Btu/lb}\]
- \[w = 128.1 - 107.1 = 21.0\ \text{Btu/lb}, \qquad w_s = 121.8 - 107.1 = 14.7\ \text{Btu/lb}\]
- \[q_{\text{rej}} = 128.1 - 43.4 = 84.7\ \text{Btu/lb} = 63.7 + 21.0\]
- \[\text{COP} = \frac{63.7}{21.0} \approx 3.03, \qquad \text{COP}_s = \frac{63.7}{14.7} \approx 4.33\]
Answer: The real cycle moves about 3 units of heat for each unit of work, against about 4.3 for an ideal compressor. The condenser must reject about 1.33 times the heat absorbed in the evaporator, which is how condensers are sized relative to evaporators.
The coefficient of performance from the chart is for the refrigerant cycle alone. The whole system's efficiency is lower, because the motor, the fans, the pumps and the controls also use electricity. Lesson 11 connects the cycle COP to the ratings printed on equipment.
# Cycle calculations from enthalpies read off a P-h chart (approximate R-134a, Btu/lb)
def cycle(name, h1, h2s, h3, eta=0.70, capacity=24000):
    h2 = h1 + (h2s - h1) / eta          # real discharge enthalpy
    q_re, w, q_rej = h1 - h3, h2 - h1, h2 - h3
    m = capacity / q_re                 # lb/h
    print(f"{name}: RE {q_re:4.1f}  w {w:4.1f}  rejected {q_rej:4.1f} Btu/lb  COP {q_re / w:4.2f}"
          f"  m {m:4.0f} lb/h  compressor {m * w / 3412:4.2f} kW  condenser {m * q_rej:6.0f} Btu/h")

cycle("design day, condensing 104 F   ", h1=107.1, h2s=121.8, h3=43.4)
cycle("dirty condenser, condensing 122 F", h1=107.1, h2s=124.4, h3=49.8)design day, condensing 104 F : RE 63.7 w 21.0 rejected 84.7 Btu/lb COP 3.03 m 377 lb/h compressor 2.32 kW condenser 31912 Btu/h dirty condenser, condensing 122 F: RE 57.3 w 24.7 rejected 82.0 Btu/lb COP 2.32 m 419 lb/h compressor 3.03 kW condenser 34352 Btu/h
The second line shows what a dirty condenser does on the chart. With the condensing temperature ten Celsius degrees (18 Fahrenheit degrees) higher, the high-pressure line moves up. Point 3 moves right, because warmer liquid has more enthalpy, so the refrigerating effect shrinks. Point 2 moves up the steeper entropy line, so the work grows. The COP falls by about a quarter, more refrigerant must circulate for the same capacity, and the compressor draws more power. This is the dental clinic's problem from Lesson 7, seen on the map.
What changes move the cycle
The P-h diagram makes it easy to see why technicians care about the conditions a system runs at.
- Higher condensing temperature, from a dirty condenser, a failed fan, hot weather or air in the system: the top line rises, the refrigerating effect falls and the work rises. Efficiency and capacity both drop.
- Lower evaporating temperature, from a dirty evaporator, low airflow or a colder setpoint than needed: the bottom line falls, the compression line gets longer, and the vapor entering the compressor is thinner, so the compressor moves less refrigerant. Capacity and efficiency drop, and the discharge temperature rises.
- More subcooling: point 3 moves left, which moves point 4 left and lengthens the refrigerating effect without changing the work. Subcooling adds capacity for free, as long as it comes from the condenser rather than from extra refrigerant crowding the condenser.
- Superheat: a moderate amount protects the compressor, and superheat picked up inside the evaporator is useful refrigeration. Superheat picked up in the suction line outside the space is not, and it moves point 1 right, raises the discharge temperature and thins the vapor. That is one reason suction lines are insulated.
The diagram also shows the limits of each refrigerant. Near the critical point, the dome narrows and the latent heat available falls sharply, so a refrigerant works best when it condenses well below its critical temperature. For carbon dioxide, with its critical point near 88 °F, the high-pressure line often runs above the dome, and the heat is rejected by cooling a dense supercritical fluid in a gas cooler instead of condensing it. On a P-h diagram, that cycle is easy to recognize: the top line passes over the dome.
Using the diagram in the field
Few technicians carry a P-h chart on a service call, but many digital gauges and apps now plot the cycle on one in real time from the pressures and temperatures they measure. Even without that, a technician who can sketch the dome and the four points on the back of a work order can reason about what a change will do: whether cleaning a coil will help, why a system loses capacity when the load falls, or why a compressor overheats when the suction superheat is high. The chart turns gauge readings into a picture of the whole cycle.
Comparing refrigerants on the chart
Every refrigerant has its own P-h diagram, and comparing them explains many design choices. A refrigerant with a wide dome at the evaporating pressure has a large latent heat, so each pound carries a lot of heat. A refrigerant whose vapor is dense at the suction pressure lets a small compressor move a lot of refrigerant. R-410A, for example, runs at much higher pressures than R-134a, and its suction vapor is several times denser, so an R-410A compressor of the same size moves far more heat. That is why R-410A replaced R-22 in residential air conditioning, and why R-134a is used where lower pressures and larger compressors are acceptable, as in chillers.
The newer A2L refrigerants, such as R-32 and R-454B, have diagrams that look much like R-410A's, with similar pressures, which is why they can replace it in new air conditioners and heat pumps without a completely different design. R-32 runs a little hotter at the compressor discharge, which the manufacturers handle in their designs. A technician does not need to memorize these diagrams, but knowing that each refrigerant has its own map, and that the chart for the wrong refrigerant gives wrong answers, is essential.
Common mistakes
MistakeReading gauge pressure on a P-h chart.
InsteadP-h charts use absolute pressure; add atmospheric pressure to gauge readings first.
MistakeMixing enthalpies from different charts or tables.
InsteadEnthalpy references differ; take all values from the same source.
MistakeDrawing the metering device as a sloping line.
InsteadExpansion is at constant enthalpy, so the line from point 3 to point 4 is vertical.
MistakeTreating the ideal compression line as the real discharge state.
InsteadReal compressors add more work; the real point 2 lies to the right of the ideal one.
Summary and key terms
- Enthalpy is heat content per unit mass; changes in enthalpy measure energy moved in each component.
- A P-h diagram plots absolute pressure (log scale) against enthalpy, with a saturation dome dividing liquid, mixture and vapor.
- The cycle plots as four points: compressor inlet, compressor outlet, condenser outlet and evaporator inlet.
- Expansion is vertical (constant enthalpy); evaporation and condensation are horizontal (constant pressure).
- Refrigerating effect = h1 − h4, work = h2 − h1, heat rejected = h2 − h3, COP = RE/w.
- Higher condensing or lower evaporating temperatures reduce capacity and COP; subcooling increases capacity.
- Enthalpy
- The heat content of a substance per unit mass, measured from a reference state.
- P-h diagram
- A chart of absolute pressure against enthalpy for one refrigerant.
- Saturated liquid line
- The left side of the dome: liquid at its saturation temperature.
- Saturated vapor line
- The right side of the dome: vapor at its saturation temperature.
- Quality
- The mass fraction of vapor in a liquid-vapor mixture, from 0 to 1.
- Isentropic compression
- Ideal compression at constant entropy, the lower limit of compressor work.
- Coefficient of performance
- The refrigerating effect divided by the work input.
Practice problems
Work each problem on paper first, then reveal the answer to check.
Enthalpies are h1 108, h2 125, h3 = h4 44 Btu/lb. What are the refrigerating effect and COP?
Show answer
RE = 108 − 44 = 64 Btu/lb; w = 17; COP ≈ 3.76.
Why is the line from the condenser outlet to the evaporator inlet vertical on a P-h chart?
Show answer
The metering device drops pressure without adding or removing heat, so enthalpy stays constant.
What happens to the refrigerating effect if subcooling increases?
Show answer
It increases, because point 3 and point 4 move left while point 1 stays put.
A gauge reads 29 psig on the low side. What pressure do you use on the P-h chart?
Show answer
About 43.7 psia.
Lesson quiz · 5 questions
Score 60% or more to complete this lesson.
Create a free account to save your progress, take quizzes and earn a certificate.