
RAC-110 · Lesson 5 of 12 · 22 min
Pressure-temperature relationships and saturation
Back in the shop, Dana set two refrigerant cylinders side by side on the bench. Both held R-134a. One was nearly full; the other was nearly empty. She connected a gauge to each. Both read the same pressure. "If pressure measured how much refrigerant was inside, these would be different," she said. "They are the same because both cylinders are at the same temperature and both still have some liquid in them. When liquid and vapor sit together, the pressure depends only on the temperature. That one fact is how we read every gauge in this trade."
This lesson explains why boiling temperature depends on pressure, what saturation means, and how technicians use pressure-temperature charts to turn a gauge reading into a temperature. It is the most important lesson in the course for reading a running system.
Boiling depends on pressure
Water boils at 212 °F only at standard sea-level pressure. At lower pressures it boils at lower temperatures, and at higher pressures at higher temperatures. In a mountain city, where the atmosphere is thinner, water boils several degrees cooler, which is why cooking times are longer there. In a pressure cooker, the trapped steam raises the pressure and water boils at about 250 °F, which is why food cooks faster. At a deep vacuum, water boils below room temperature, which is how a vacuum pump dries out a refrigeration system.
The reason is the balance between molecules leaving the liquid and molecules returning to it. At any temperature, some molecules in a liquid have enough energy to escape into the space above. The pressure that the escaped molecules exert when the two are in balance is the vapor pressure, and it rises steeply with temperature. A liquid boils when its vapor pressure equals the pressure around it. Raise the surrounding pressure and the liquid has to get hotter before its vapor pressure catches up; lower it, and the liquid boils at a cooler temperature.
Every liquid has its own vapor pressure curve. Refrigerants are chosen because their curves fall in a useful range. R-134a, for example, boils at about −15 °F at atmospheric pressure, so at the pressures a system can easily produce, it boils at the low temperatures needed in an evaporator and condenses at the high temperatures reached in a condenser.
Saturation
When a liquid and its vapor are together and in balance, both are said to be saturated, and they are at the saturation temperature for their pressure, or the saturation pressure for their temperature. Pick one and the other is fixed. A saturated liquid is liquid at its boiling point, ready to start boiling with any more heat; a saturated vapor is vapor at its condensing point, ready to start condensing with any less heat. In between, a mixture of the two stays at the same temperature while heat changes the proportions, which is the latent heat plateau from Lesson 3.
Liquid colder than the saturation temperature for its pressure is subcooled. It can take some sensible heat before it starts to boil. Vapor hotter than the saturation temperature for its pressure is superheated. It can lose some sensible heat before it starts to condense. These two words, which come up in every service call, are the subject of Lesson 7.
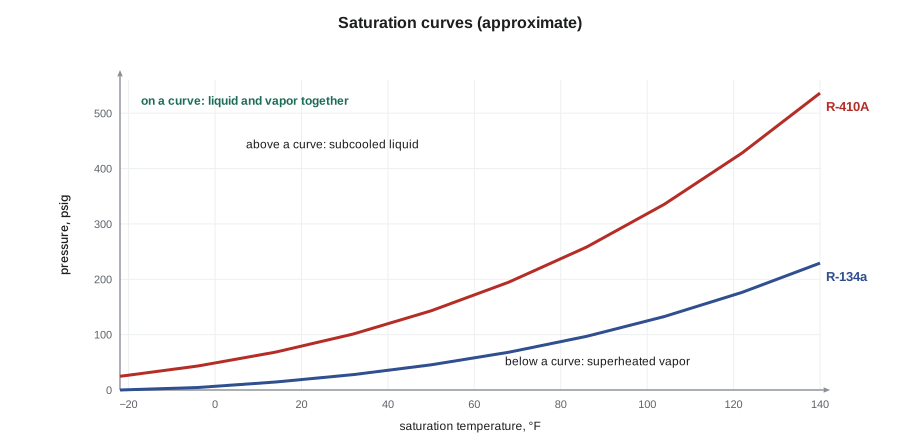
The pressure-temperature relationship holds only where liquid and vapor are present together. Inside a cylinder with liquid in the bottom, inside an evaporator where refrigerant is boiling, and inside a condenser where it is condensing, the pressure tells you the temperature. In a line full of only vapor or only liquid, it does not: the pressure tells you the saturation temperature, and the actual temperature can be higher (superheated vapor) or lower (subcooled liquid). That difference is what makes the gauges useful.
Dana's two cylinders show the practical consequence. A cylinder's pressure cannot tell you how much refrigerant is left; only weighing it can. And a cylinder left in a hot van will rise in pressure with its temperature, regardless of how full it is, until the liquid expands to fill it completely. At that point, with no vapor space left, a small further rise in temperature produces a huge rise in pressure, which is why cylinders are never filled beyond their rated amount and never heated.
The pressure-temperature chart
A pressure-temperature chart, or P-T chart, lists saturation pressures against temperatures for one or more refrigerants. Technicians carry them as printed cards, as scales printed on analog gauges and as tables built into digital gauges and phone apps. Most technician charts use gauge pressure, and engineering tables use absolute pressure, so the first thing to check is which kind the chart uses. In a running system, the chart answers two questions every time the gauges are connected: what temperature the refrigerant is boiling at in the evaporator, from the suction pressure, and what temperature it is condensing at in the condenser, from the discharge or liquid pressure.
| Temperature, °F | R-134a, psig | R-410A, psig |
|---|---|---|
| 0 | 6.5 | 48.6 |
| 10 | 12.0 | 62.3 |
| 20 | 18.4 | 78.3 |
| 30 | 26.1 | 96.8 |
| 40 | 35.0 | 118 |
| 50 | 45.4 | 142 |
| 60 | 57.4 | 170 |
| 70 | 71.1 | 201 |
| 80 | 86.7 | 236 |
| 90 | 104 | 274 |
| 100 | 124 | 317 |
| 110 | 146 | 365 |
| 120 | 171 | 418 |
| 130 | 199 | 476 |
| 140 | 229 | 541 |
The table makes two points clear. First, pressure rises faster than temperature: from 32 to 104 °F, the absolute saturation pressure of R-134a more than triples. Second, refrigerants differ a great deal. R-410A runs at roughly two and a half times the pressure of R-134a at the same temperature, which is why its equipment, hoses and gauges are rated for higher pressures and why mixing up refrigerants is dangerous.
Worked problem
Reading the evaporator temperature
The ductless heat pump runs on R-410A. In cooling mode, Theo's low-side gauge reads 118 psig. What temperature is the refrigerant boiling at in the indoor coil?
Show solution
- \[118\ \text{psig} \to 40\ ^\circ\text{F} \ \text{(directly from the table)}\]
Answer: About 40 °F. This is the evaporator saturation temperature, the temperature of the boiling refrigerant, not the temperature of the air or of the suction line.
Worked problem
Reading the condensing temperature
On the same system, the high-side gauge reads 375 psig on a hot afternoon. What is the condensing temperature?
Show solution
- \[T = 110 + 10 \times \frac{375 - 365}{418 - 365} = 110 + 10 \times \frac{10}{53} \approx 112\ ^\circ\text{F}\]
Answer: About 112 °F. On a hot day with outdoor air at 92 °F, that is about 20 degrees above the air, a normal range for many air-cooled condensers. A much larger difference would suggest a dirty coil, a failed fan or too much refrigerant.
Interpolating a pressure-temperature table
Tables give values at steps, and real readings fall in between. Linear interpolation assumes a straight line between two neighboring rows. Because saturation pressure curves upward, a straight line between two rows slightly overestimates the pressure in between, or underestimates the temperature for a given pressure. For steps of 10 degrees Celsius or Fahrenheit, the error is small, usually a fraction of a degree. A better approach, used in digital tools, interpolates the logarithm of pressure, because the logarithm of saturation pressure is nearly a straight line against temperature. The program below compares the two on the approximate table above.
# Interpolating an approximate saturation table (psig) for R-410A
import math

table = [(0, 48.6), (10, 62.3), (20, 78.3), (30, 96.8), (40, 118), (50, 142), (60, 170),
         (70, 201), (80, 236), (90, 274), (100, 317), (110, 365), (120, 418), (130, 476)]  # (deg F, psig), approximate
P_ATM = 14.7

def sat_temp(psig, log=False):
    p_abs = psig + P_ATM                      # interpolate on absolute pressure
    for (t1, g1), (t2, g2) in zip(table, table[1:]):
        p1, p2 = g1 + P_ATM, g2 + P_ATM
        if p1 <= p_abs <= p2:
            if log:
                f = (math.log(p_abs) - math.log(p1)) / (math.log(p2) - math.log(p1))
            else:
                f = (p_abs - p1) / (p2 - p1)
            return t1 + f * (t2 - t1)
    raise ValueError("pressure outside the table")

for psig in [55, 118, 130, 375]:
print(f"{psig:4d} psig: linear {sat_temp(psig):6.1f} F, log {sat_temp(psig, log=True):6.1f} F")55 psig: linear 4.7 F, log 4.9 F 118 psig: linear 40.0 F, log 40.0 F 130 psig: linear 45.0 F, log 45.2 F 375 psig: linear 111.9 F, log 112.0 F
The two methods agree within a few tenths of a degree on this table, which is better than the accuracy of most field thermometers. What matters more in practice is using the right refrigerant's chart, using gauge or absolute pressure consistently, and remembering that the chart value is a saturation temperature, not a pipe temperature.
Blends, glide, bubble point and dew point
Many modern refrigerants are blends of two or more pure substances. In an azeotropic blend, the components boil together like a single fluid. In a zeotropic blend, the more volatile component boils off first, so the blend does not boil at one temperature at a fixed pressure: it starts to boil at the bubble point and finishes at the higher dew point. The difference is the temperature glide. R-410A is a near-azeotropic blend with a glide of only a fraction of a degree, so it is treated like a single fluid. Some blends, such as R-407C, have a glide of several degrees, and some newer low-GWP blends have a glide of about a degree or more.
For blends with glide, P-T charts list two temperatures for each pressure, or two pressures for each temperature. The rule technicians use is: use the dew point when working with vapor, as in superheat calculations at the evaporator outlet, and use the bubble point when working with liquid, as in subcooling calculations at the condenser outlet. Many digital gauges do this automatically when the refrigerant is selected. Blends with glide are also charged as liquid from the cylinder, so that the components enter the system in the right proportion; RAC-220 covers charging in detail.
The critical point
The saturation curve does not go on forever. At the critical point, the liquid and vapor become identical, and above it there is no boiling or condensing, only a dense fluid. For most refrigerants, the critical temperature is far above any condensing temperature, but for carbon dioxide, R-744, it is only about 88 °F, at about 1,070 psia. On a warm day, a carbon dioxide system rejects heat above the critical point and cannot condense in the usual sense, so the high-side heat exchanger is called a gas cooler and the system is called transcritical. RAC-420 covers these systems.
Using the relationship safely
The pressure-temperature relationship also explains several hazards. A refrigerant spilled as liquid at atmospheric pressure instantly drops to its atmospheric boiling point, far below freezing, as it flashes to vapor, which causes frostbite. A refrigerant cylinder warmed in the sun climbs in pressure with its temperature. A system shut off on a hot day equalizes to the saturation pressure at the warmest place where liquid sits, which can be much higher than its running suction pressure. And a standing pressure check on an unlabeled cylinder, comparing its pressure with the P-T chart at a known temperature, suggests what the refrigerant is but cannot prove it: blends, contaminated refrigerant and air in the cylinder all change the reading, which is why unknown refrigerant is identified with an analyzer before it is used.
A standing pressure check
When a system has been off long enough for everything to reach the same temperature, the refrigerant settles at the saturation pressure for that temperature, wherever liquid is present. Technicians use this as a quick check. If an air conditioner has been off overnight in a garage at 68 °F, and it holds R-410A, its gauges should read close to the saturation pressure at that temperature from the P-T chart. A much lower reading suggests that the liquid is gone and only vapor remains, which means much of the charge has leaked out. A higher reading than the chart suggests air or another gas in the system, because a non-condensable gas adds its own pressure on top of the refrigerant's.
The check has limits. Parts of a system in the sun or near a warm furnace will be warmer than the rest, and the pressure follows the warmest place where liquid sits. Blends with glide read between their bubble and dew pressures. And a system can be short of refrigerant while still holding enough liquid to show a normal standing pressure. It is a first look, not a diagnosis, but it takes only a minute and it can save a lot of time.
Common mistakes
MistakeReading the P-T chart as a pipe temperature.
InsteadThe chart gives the saturation temperature; the actual temperature of vapor or liquid in a line can be higher or lower.
MistakeJudging how much refrigerant is in a cylinder from its pressure.
InsteadWhile liquid remains, pressure depends only on temperature; weigh the cylinder.
MistakeUsing the wrong refrigerant's chart, or mixing gauge and absolute values.
InsteadConfirm the refrigerant from the nameplate and the chart's pressure basis before reading it.
MistakeIgnoring glide on a zeotropic blend.
InsteadUse the dew point for superheat and the bubble point for subcooling.
Summary and key terms
- A liquid boils when its vapor pressure equals the surrounding pressure, so boiling temperature rises with pressure.
- Where liquid and vapor coexist, they are saturated, and pressure fixes temperature.
- Liquid below its saturation temperature is subcooled; vapor above it is superheated.
- P-T charts convert gauge readings into evaporating and condensing temperatures; check gauge or absolute and the refrigerant.
- Zeotropic blends glide between a bubble point and a dew point; near-azeotropes such as R-410A have negligible glide.
- Above the critical point there is no condensing; carbon dioxide's low critical temperature leads to transcritical systems.
- Saturation temperature
- The boiling or condensing temperature of a substance at a given pressure.
- Saturation pressure
- The pressure at which a substance boils or condenses at a given temperature.
- Vapor pressure
- The pressure exerted by a vapor in balance with its liquid.
- Subcooled liquid
- Liquid colder than its saturation temperature at its pressure.
- Superheated vapor
- Vapor hotter than its saturation temperature at its pressure.
- P-T chart
- A table or scale of saturation pressure against temperature for a refrigerant.
- Temperature glide
- The difference between the dew point and bubble point of a zeotropic blend at a fixed pressure.
- Critical point
- The temperature and pressure above which liquid and vapor cannot be told apart.
Practice problems
Work each problem on paper first, then reveal the answer to check.
Using the approximate table, what is the saturation temperature of R-134a at 35 psig?
Show answer
40 °F.
An R-410A system's suction is 97 psig. What is the evaporating temperature?
Show answer
About 30 °F.
Two R-410A cylinders sit in the same van at the same temperature. One is full, one is a quarter full. How do their pressures compare?
Show answer
They are the same, as long as both still contain liquid.
Which point of a zeotropic blend is used for a superheat calculation?
Show answer
The dew point.
Lesson quiz · 5 questions
Score 60% or more to complete this lesson.
Create a free account to save your progress, take quizzes and earn a certificate.