
PYTH-230 · Lesson 6 of 12 · 26 min
Debugging with a debugger
▶ Video coming soon A video version of this lesson is on the way.
Tests tell you that something is wrong. They do not always tell you why. On the first Friday of December, Kai reported that the weekly roast summary said the Sumatra Dark had lost nearly a third of its weight in roasting, which is impossible for a medium-dark roast. The summary's tests all passed. Somewhere between the roast log file and the printed report, a number was going wrong, and Jordan had to find where.
Finding and fixing the cause of a known failure is called debugging. It is a skill in its own right, separate from writing code, and the difference between a developer who spends ten minutes on a bug and one who spends a day is mostly method. This lesson covers a systematic approach to debugging, reading tracebacks, print debugging and its modern variants, the pdb debugger and the debuggers built into editors, and strategies for narrowing down a problem. It finishes with the step that turns every bug into a permanent improvement: the regression test.
Debugging is the scientific method
The least effective way to debug is to stare at the code and change things until the problem goes away. The most effective way treats the bug as an experiment. First, reproduce it reliably, ideally with a small test. Second, gather facts: what exactly happens, with which input, and what should happen instead. Third, form a hypothesis about the cause. Fourth, design a quick experiment that would prove the hypothesis wrong, such as printing a value or stepping through a function. Fifth, if the hypothesis survives, fix the cause, not the symptom. Finally, keep the reproducing test so the bug can never return.
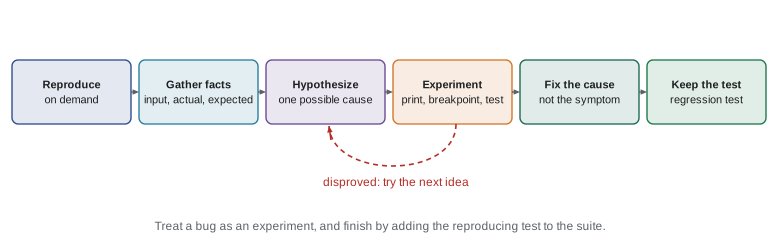
The step people most often skip is the first. A bug you cannot reproduce on demand is a bug you cannot confirm you have fixed. For Kai's report, Jordan's first move was to copy the week's roast log into a test and check that the summary really did report that impossible loss for the Sumatra Dark. It did, and from that moment the problem was a test failure on Jordan's laptop instead of a vague complaint.
Reading a traceback
When Python stops with an exception, it prints a traceback: the chain of function calls that were active, from the outermost at the top to the innermost, where the exception was raised, at the bottom. Read it from the bottom up. The last line names the exception type and message, which is usually the single most useful piece of information. The lines above it show where it happened, as file, line number and function, with the line of code itself.
> python roast_summary.py roast_log.csv
Traceback (most recent call last):
  File "roast_summary.py", line 41, in <module>
    main(sys.argv[1])
  File "roast_summary.py", line 36, in main
    report = summarize(rows)
  File "roast_summary.py", line 22, in summarize
    loss = (row["green_kg"] - row["roasted_kg"]) / row["green_kg"]
TypeError: unsupported operand type(s) for -: 'str' and 'str'
This traceback says that line 22, inside summarize, tried to subtract two strings. The fix is not on line 22 itself, which is correct for numbers, but wherever the rows were read: csv.DictReader returns every field as text, and the code forgot to convert the weights with float. A traceback shows where the error surfaced, which is often downstream of where the mistake was made. Following the bad value back to its origin is the real work.
You can also work with tracebacks from code. The traceback module can format or walk the stack of a caught exception, which is useful in logs. The listing below catches an error and prints just the function names and line numbers of each frame.
import traceback

def parse(row):
    return float(row["roasted_kg"])

def summarize(rows):
    return [parse(r) for r in rows]

try:
    summarize([{"roasted_kg": "10.2"}, {"roasted_kg": "ten"}])
except ValueError as err:
    for frame in traceback.extract_tb(err.__traceback__):
        print(f"line {frame.lineno:>2} in {frame.name}")
print(type(err).__name__ + ":", err)line 10 in <module> line 7 in summarize line 4 in parse ValueError: could not convert string to float: 'ten'
Print debugging, done well
The oldest debugging tool is the print statement: add a few prints, run the program and look at the values. It is quick and works everywhere, including on this page, and experienced developers still use it constantly. Python's f-strings make it better: writing {name=} inside an f-string prints both the expression and its value, so you never have to wonder which number is which.
rows = [
    {"sku": "RC-104", "green_kg": "12.0", "roasted_kg": "10.1"},
    {"sku": "RC-104", "green_kg": "12.0", "roasted_kg": "8.3"},
]

def loss_fraction(row):
    green = float(row["green_kg"])
    roasted = float(row["roasted_kg"])
    loss = (green - roasted) / green
    print(f"{row['sku']=} {green=} {roasted=} {loss=:.3f}")   # temporary
    return loss

losses = [loss_fraction(r) for r in rows]
print(f"{sum(losses) / len(losses)=:.3f}")row['sku']='RC-104' green=12.0 roasted=10.1 loss=0.158 row['sku']='RC-104' green=12.0 roasted=8.3 loss=0.308 sum(losses) / len(losses)=0.233
The trace shows the problem at once: the second Sumatra batch was logged as 8.3 kg roasted from 12.0 kg green, a loss of about 31 hundredths, which dragged the weekly average up. A typo in the roast log, 8.3 instead of 10.3, not a bug in the code. Jordan added a check that flags any batch losing more than a fifth of its weight, so a typo like that is caught at entry, and asked Kai to correct the log.
Print debugging has limits. You have to guess in advance which values to print, you have to rerun the program for every new guess, and the prints must be removed afterwards; a forgotten debug print in a receipt is embarrassing. For a deeper look, a debugger is faster.
The pdb debugger
A debugger lets you pause a running program at a chosen line, look at every variable, run the code one line at a time, and step into the functions it calls. Python's built-in debugger is pdb. The simplest way to use it is to put a call to the built-in function breakpoint() on the line where you want to stop, then run the program normally in a terminal. When execution reaches breakpoint(), you get a (Pdb) prompt where you can type commands.
def summarize(rows):
    report = {}
    for row in rows:
        green = float(row["green_kg"])
        roasted = float(row["roasted_kg"])
        breakpoint()                      # pause here and open the (Pdb) prompt
        report.setdefault(row["sku"], []).append((green - roasted) / green)
return report> python roast_summary.py roast_log.csv
> roast_summary.py(7)summarize()
-> report.setdefault(row["sku"], []).append((green - roasted) / green)
(Pdb) p row["sku"], green, roasted
('RC-101', 12.0, 10.2)
(Pdb) c
> roast_summary.py(7)summarize()
-> report.setdefault(row["sku"], []).append((green - roasted) / green)
(Pdb) p row["sku"], green, roasted
('RC-104', 12.0, 8.3)
(Pdb) p (green - roasted) / green
0.30833333333333335
(Pdb) w
roast_summary.py(41)<module>()
roast_summary.py(36)main()
> roast_summary.py(7)summarize()
(Pdb) qA handful of commands covers almost everything. The table lists them. Any Python expression can also be typed at the prompt to evaluate it, which makes pdb an interactive window into the paused program.
pdb can also be used after a crash. Running a script with python -m pdb script.py starts it under the debugger; if it raises an uncaught exception, pdb opens at the line that failed, with every variable intact, which is called post-mortem debugging. pytest offers the same thing with pytest --pdb, which opens the debugger at the point where a test failed. A breakpoint can be conditional, such as b 7, row['sku'] == 'RC-104', so that it only stops for the case you care about instead of every loop iteration.
The in-browser Python on this page cannot run an interactive debugger, because there is no terminal to type commands into, so the pdb listings here are transcripts. Try them on your own computer with the roast summary script; it takes a few minutes to become comfortable and repays the time on the first real bug.
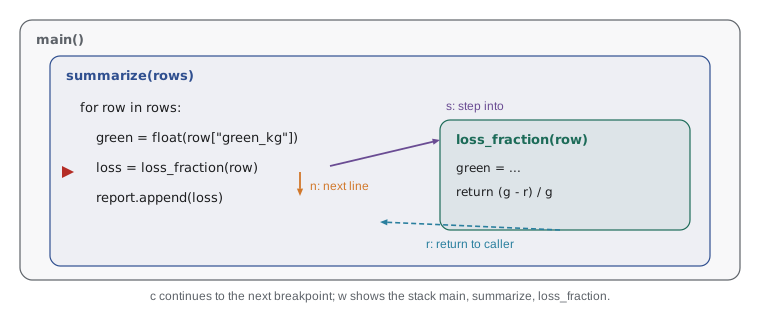
Debuggers in editors
Editors such as VS Code, PyCharm and others wrap the same idea in a graphical interface. You click in the margin to set a breakpoint, start the program with the debug button, and when it pauses you see every local variable in a panel, the call stack in another, and buttons for step over, step into, step out and continue. You can add watch expressions that are re-evaluated at every step, and set conditional breakpoints or logpoints, which print a message without stopping. Jordan uses VS Code's debugger for most work and pdb when connected to the Ridgeline server, which has no screen.
Narrowing the search
When a bug's location is not obvious, cut the search space in half repeatedly. If a long input file triggers the bug, try the first half; if the bug persists, the cause is in that half, so halve again. A dozen halvings narrow ten thousand lines to one. The same trick works on time: if the code worked last month and fails today, git bisect, from PYTH-110, checks out the commit halfway between, you test it and mark it good or bad, and git keeps halving the history until it names the commit that introduced the bug.
A minimal reproduction is the end goal of narrowing: the smallest program and input that still show the bug. It is often the moment the cause becomes obvious, and it is exactly what you should include when asking a colleague, or the maintainers of a library, for help. Explaining the problem out loud, even to an inanimate object, works surprisingly often too; this is called rubber duck debugging, after a story of a programmer who explained code line by line to a rubber duck and found the bug halfway through.
Worked problem
Hunting a missing loyalty point
Mei reports that a customer who spent exactly 20.00 got 19 points instead of 20. The total is computed as round(subtotal * 1.0, 2) in dollars, then points = int(total). Find and fix the cause systematically.
Show solution
- Reproduce: a test with a 20.00 total expects 20 points; it fails with 19.
- Gather facts: print f"{total=}" inside the function; it shows total=19.999999999999996.
- Hypothesis: the subtotal is built by adding floats such as 3.25 and 5.25, which are not exact.
- Experiment: sum the receipt's floats in the shell; the result is just under 20. Confirmed.
- Fix the cause: keep money in integer cents (or Decimal) and compute points as cents // 100; keep the test.
Answer: Floating-point dollars made 20.00 slightly less than 20; working in whole cents fixes the cause, and the test guards it.
Common kinds of bug
Most bugs belong to a small number of families, and knowing them speeds up the hypothesis step. Off-by-one errors use < where <= was meant, or slice one item too few or too many. Aliasing bugs change a list or dictionary through one name and are surprised to see the change through another, because both names refer to the same object. Mutable default arguments share one list between calls, as PYTH-102 showed. Type confusions add strings that should have been numbers, as in the traceback above. Missing return statements make a function return None on one path. Floating-point surprises make 0.1 + 0.2 slightly different from 0.3. Each family has a quick experiment that confirms or rules it out.
plan = [["RC-101", 0], ["RC-104", 0]]
monday = plan                    # NOT a copy: both names refer to one list
monday[1][1] = 20                # order 20 bags of RC-104 on Monday
print("plan:", plan)

import copy
plan = [["RC-101", 0], ["RC-104", 0]]
tuesday = copy.deepcopy(plan)    # an independent copy, inner lists included
tuesday[1][1] = 15
print("plan:", plan, "tuesday:", tuesday)
print(monday is plan, tuesday is plan)plan: [['RC-101', 0], ['RC-104', 20]] plan: [['RC-101', 0], ['RC-104', 0]] tuesday: [['RC-101', 0], ['RC-104', 15]] False False
The fix is not finished until there is a test
Once the cause is found and fixed, add the reproducing test to the suite, if it is not there already, and run all the tests. The new test proves the fix; the others prove the fix broke nothing else. Then remove any temporary prints and breakpoints. A quick search for breakpoint( and for print statements with an equals sign inside braces before committing catches leftovers, and many teams add a linter rule, covered in lesson 8, that flags them automatically.
Finally, ask whether the same mistake could exist elsewhere. Jordan's roast-log typo led to a validation rule at entry; the float-dollar loyalty bug in the example led to a search for every other place that did arithmetic on float dollars. Fixing one instance of a bug is good; removing the conditions that allowed it is better.
Try it yourself
Off by one
recent_sales(sales, n) should return the last n sales from the list, oldest first, and an empty list when n is 0. The current version returns one sale too few, and something odd for n equal to 0. Fix it.
def recent_sales(sales, n):
    return sales[len(sales) - n + 1:]

print(recent_sales([101, 102, 103, 104, 105], 3))
Try it yourself
The shared order plan
plan_week(base) should return a dictionary of seven independent daily order plans, one per day name, each starting as a copy of base (a dictionary of coffee codes to bags). Changing one day must not change the others or base. The current version has an aliasing bug. Fix it.
DAYS = ['Mon', 'Tue', 'Wed', 'Thu', 'Fri', 'Sat', 'Sun']

def plan_week(base):
    return {day: base for day in DAYS}

week = plan_week({'RC-101': 0, 'RC-104': 0})
week['Mon']['RC-104'] = 20
print(week['Tue'])
Try it yourself
The missing return
shipping_cents(subtotal_cents) should return 0 for orders of 5000 cents or more (free shipping), 795 for orders from 2500 to 4999, and 1295 below 2500. A customer reported a crash: the function returns None for some orders. Find the path with no return and fix it.
def shipping_cents(subtotal_cents):
    if subtotal_cents >= 5000:
        return 0
    elif subtotal_cents >= 2500:
        cost = 795
    else:
        return 1295

print(shipping_cents(3000))
Common mistakes
MistakeChanging code at random until the symptom disappears.
InsteadReproduce, form a hypothesis, test it, then fix the cause.
MistakeReading a traceback from the top.
InsteadStart at the last line, the exception, then look at the frames just above it.
MistakeFixing the line where the error surfaced when the bad value came from earlier.
InsteadFollow the value back to where it was created or mis-read.
MistakeLeaving debug prints and breakpoint() calls in committed code.
InsteadSearch for them before committing, or let a linter flag them.
MistakeAssuming b = a copies a list or dictionary.
InsteadUse list(a), dict(a) or copy.deepcopy(a) when you need an independent copy.
MistakeFixing a bug without adding a test that reproduces it.
InsteadKeep the reproducing test so the bug cannot return unnoticed.
Summary and key terms
- Debug systematically: reproduce, gather facts, hypothesize, experiment, fix the cause, keep a regression test.
- Read tracebacks from the bottom: the exception and message, then the frames that led there; the mistake may be upstream.
- Print debugging is quick; f-strings with {name=} label every value.
- breakpoint() opens pdb; n, s, c, p, l, w, u, b, r and q cover most needs; python -m pdb and pytest --pdb give post-mortem debugging.
- Editor debuggers add clickable breakpoints, variable panels, watches, conditional breakpoints and logpoints.
- Halve the search space with smaller inputs or git bisect, and aim for a minimal reproduction.
- Know the common bug families: off-by-one, aliasing, mutable defaults, type confusion, missing return, floating point.
- debugging
- Finding and fixing the cause of a known failure.
- traceback
- The report of the chain of calls active when an exception was raised.
- breakpoint
- A place in the code where a debugger pauses the program.
- pdb
- Python's built-in command-line debugger.
- stepping
- Running a paused program one line at a time, into or over function calls.
- post-mortem debugging
- Opening a debugger at the point where a program crashed, with its variables intact.
- conditional breakpoint
- A breakpoint that pauses only when a given expression is true.
- minimal reproduction
- The smallest program and input that still show a bug.
- aliasing
- Two names referring to the same object, so a change through one is seen through the other.
- rubber duck debugging
- Explaining code out loud, line by line, to find a mistake.
Practice problems
Work each problem on paper first, then reveal the answer to check.
Which line of a traceback do you read first?
Show answer
The last line: the exception type and its message.
A TypeError says you cannot subtract str from str on a correct-looking line. Where is the real mistake likely to be?
Show answer
Where the values were read, for example csv fields that were never converted to numbers.
What does print(f"{loss=:.3f}") print when loss is 0.3083?
Show answer
loss=0.308
In pdb, what is the difference between n and s?
Show answer
n runs the line and stops at the next line in the same function; s steps into any function the line calls.
The code worked on 1 November and fails today. Which tool finds the commit that broke it?
Show answer
git bisect.
After b = a, where a is a list, you change b[0]. What happens to a, and why?
Show answer
a changes too, because a and b refer to the same list.
Lesson quiz · 5 questions
Score 60% or more to complete this lesson.
Create a free account to save your progress, take quizzes and earn a certificate.