
PET-499 · Lesson 4 of 12 · 19 min
Fluid characterization and PVT
Mateo's first technical task is the fluid. Every later calculation uses fluid properties: the formation volume factor converts reservoir volumes to stock-tank volumes in the oil-in-place estimate; compressibility and the bubble point govern the material balance; viscosity sets well productivity and the mobility ratio of a waterflood; the gas composition decides how the gas is handled and sold. Mei Lin sends the full laboratory report on the two good bottomhole samples and the recombined separator samples. This lesson covers how the team classifies the fluid, checks the laboratory data against correlations and physical sense, and identifies what the fluid means for the development.
What kind of oil is it?
The stock-tank oil is 43° API, a light oil, and the initial solution gas-oil ratio is 900 scf/STB. The gas is rich in ethane and heavier components, with a specific gravity of 0.80 relative to air, and it contains 1.0 mole percent hydrogen sulfide and 2.4 percent carbon dioxide. With a gas-oil ratio below the common threshold of about 1,750 scf/STB between black oils and volatile oils, and a formation volume factor below 2, the fluid is a black oil: its behavior can be described by the conventional black-oil properties, Rs, Bo and Bg as functions of pressure, without a full compositional model.
Black-oil classification is a practical choice, not a law of nature. For a waterflood above the bubble point, which is the most likely development, black-oil properties are entirely adequate. If the team were considering gas injection, or if the reservoir were expected to fall well below the bubble point, the changing composition of the liberated gas and the remaining oil would matter more, and an equation-of-state model tuned to the laboratory data would be justified. The team records that as a condition: if gas injection is ever considered for Spruce Ridge, the PVT model must be revisited.
The laboratory tests
The laboratory report contains four main experiments. A constant composition expansion lowers the pressure on a sample in steps without removing anything from the cell, and records the total volume. Above the bubble point the volume increases slowly as the liquid expands; at the bubble point the first gas appears and the volume increases much faster. The break in slope gives the bubble point, and the slope above it gives the oil compressibility. A differential liberation removes the liberated gas at each pressure step, which mimics what happens in the reservoir below the bubble point when gas moves away from the oil, and gives the solution gas-oil ratio and formation volume factor as functions of pressure. Separator tests flash a sample through one or more stages at chosen separator conditions to stock-tank conditions, which gives the gas-oil ratio and formation volume factor that the surface facilities will actually see. Finally, a viscometer measures the oil viscosity at reservoir temperature over a range of pressures.
Differential liberation and separator flash give slightly different values, because the path from reservoir to stock tank is different. The standard practice is to adjust the differential liberation data to the separator conditions chosen for the field using the ratio of the separator and differential formation volume factors at the bubble point. The values in this lesson are already adjusted to a two-stage separation at the battery, which is how the oil will be produced.
| Property | Value | Source |
|---|---|---|
| Bubble point at 245 °F | 3,080 psia | Constant composition expansion, two samples within 1 percent |
| Initial pressure at datum | 6,050 psia | Formation pressure tests (Lesson 2) |
| Formation volume factor at initial pressure | 1.477 rb/STB | Separator-adjusted |
| Formation volume factor at bubble point | 1.523 rb/STB | Separator-adjusted |
| Solution gas-oil ratio | 900 scf/STB | Two-stage separator test |
| Oil viscosity at initial pressure | 0.40 cp | Viscometer |
| Stock-tank oil gravity | 43° API | Separator test |
| Hydrogen sulfide in solution gas | 1.0 mole percent | Gas chromatography and stain tube |
| Wax appearance temperature, pour point | 84 °F, 25 °F | Stock-tank oil |
Checking the laboratory data
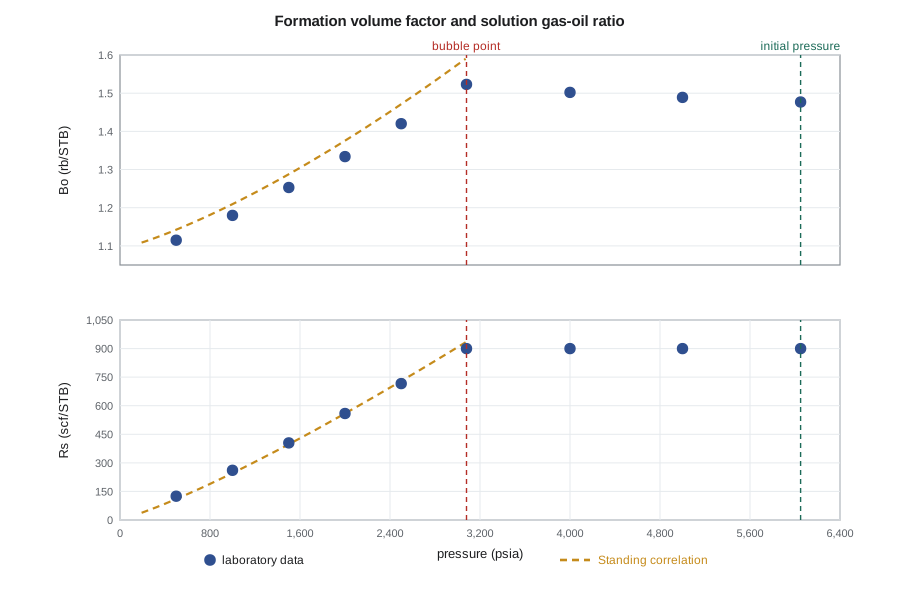
Laboratory data are measurements, and measurements can be wrong: a leaking cell, a contaminated sample or a transcription error in the report. The team checks the data three ways. First, internal consistency: Rs and Bo should decrease smoothly with pressure below the bubble point, and the relative volume above it should follow a smooth compressibility trend. Second, comparison with a correlation such as Standing's, which is not accurate enough to replace the laboratory data but will catch gross errors. Third, comparison with independent field data: the oil density implied by the PVT data should match the oil gradient from the formation pressure tests.
Standing's correlations, published in 1947 from California crude oils, estimate the bubble point from the solution gas-oil ratio, gas gravity, oil gravity and temperature, and the formation volume factor from the same variables. In oilfield units, with temperature in °F and pressure in psia:
# Checking laboratory PVT data against the Standing correlations, oil compressibility, and a fluid-gradient cross-check.
SI = False     # True: Canadian case (kPa, m3/m3, deg C), False: US case (psia, scf/STB, deg F)
if SI:
    T_c, api, gg, h2s = 98.0, 41.0, 0.82, 0.022
    pb_lab, rsi = 19400.0, 150.0
    # differential liberation: pressure kPa, Rs m3/m3, Bo m3/m3
    lab = [(30850, 150, 1.446), (26000, 150, 1.456), (22000, 150, 1.465), (19400, 150, 1.478),
           (16000, 122, 1.388), (12000, 88, 1.286), (8000, 56, 1.194), (4000, 26, 1.112)]
    kpa = 1.0; rs_f = 5.6146                     # kPa per unit; scf/STB per m3/m3
    grad_density = 656.1                         # kg/m3 from the pressure gradient (Lesson 2)
else:
    T_c, api, gg, h2s = (245.0 - 32) / 1.8, 43.0, 0.80, 0.010
    pb_lab, rsi = 3080.0, 900.0
    lab = [(6050, 900, 1.477), (5000, 900, 1.489), (4000, 900, 1.502), (3080, 900, 1.523),
           (2500, 716, 1.420), (2000, 559, 1.334), (1500, 405, 1.253), (1000, 261, 1.180), (500, 125, 1.115)]
    kpa = 6.894757; rs_f = 1.0
    grad_density = 41.7                          # lb/ft3 from the pressure gradient
T_f = T_c * 1.8 + 32
go = 141.5 / (131.5 + api)                       # stock-tank oil specific gravity
def standing_pb(rs_scf):                          # psia
    return 18.2 * ((rs_scf / gg) ** 0.83 * 10 ** (0.00091 * T_f - 0.0125 * api) - 1.4)
def standing_rs(p_psia):                          # scf/STB below the bubble point
    return gg * ((p_psia / 18.2 + 1.4) * 10 ** (0.0125 * api - 0.00091 * T_f)) ** 1.2048
def standing_bo(rs_scf):
    return 0.9759 + 0.00012 * (rs_scf * (gg / go) ** 0.5 + 1.25 * T_f) ** 1.2
u = "kPa" if SI else "psia"
pb_st = standing_pb(rsi * rs_f) * 6.894757 / kpa
print(f"oil gravity {api:.0f} API (SG {go:.4f}); bubble point: lab {pb_lab:,.0f} {u}, Standing {pb_st:,.0f} {u} ({100 * (pb_st / pb_lab - 1):+.1f} percent)")
print(f"{'p (' + u + ')':>11s} {'Rs lab':>8s} {'Rs St.':>8s} {'Bo lab':>7s} {'Bo St.':>7s}")
for p, rs, bo in lab:
    if p <= pb_lab:
        rs_st = standing_rs(p * kpa / 6.894757) / rs_f
        bo_st = standing_bo(rs_st * rs_f)
        print(f"{p:11,.0f} {rs:8.0f} {rs_st:8.0f} {bo:7.3f} {bo_st:7.3f}")
bob = {p: b for p, _, b in lab}[pb_lab]; boi = lab[0][2]
co = (bob - boi) / ((bob + boi) / 2 * (lab[0][0] - pb_lab))
print(f"undersaturated oil compressibility from the lab data: {co:.2e} per {u[:3]}")
# reservoir oil density at initial pressure, compared with the gradient from the pressure survey
if SI:
    rho = (1000 * go + rsi * gg * 1.225) / boi; unit = "kg/m3"
else:
    rho = (350.2 * go + rsi * 0.0764 * gg) / (boi * 5.6146); unit = "lb/ft3"
print(f"reservoir oil density at initial pressure: {rho:.1f} {unit}; from the pressure gradient {grad_density} {unit} ({100 * (grad_density / rho - 1):+.1f} percent)")
p_h2s = h2s * pb_lab * kpa
print(f"H2S partial pressure in the gas at the bubble point: {p_h2s:,.0f} kPa ({p_h2s / 6.894757:,.1f} psia); sour service applies above 0.3 kPa (0.05 psia)")oil gravity 43 API (SG 0.8109); bubble point: lab 3,080 psia, Standing 2,980 psia (-3.2 percent)
p (psia) Rs lab Rs St. Bo lab Bo St.
3,080 900 936 1.523 1.592
2,500 716 730 1.420 1.471
2,000 559 559 1.334 1.376
1,500 405 397 1.253 1.288
1,000 261 246 1.180 1.210
500 125 110 1.115 1.142
undersaturated oil compressibility from the lab data: 1.03e-05 per psi
reservoir oil density at initial pressure: 40.9 lb/ft3; from the pressure gradient 41.7 lb/ft3 (+2.0 percent)
H2S partial pressure in the gas at the bubble point: 212 kPa (30.8 psia); sour service applies above 0.3 kPa (0.05 psia)Standing's bubble point is 2,980 psia, 3.2 percent below the measured 3,080 psia, which is well within the correlation's usual scatter. Below the bubble point the correlation's solution gas-oil ratio follows the laboratory values closely; its formation volume factor runs 3 to 5 percent high, a known tendency for light oils at high temperature. Nothing in the comparison suggests a bad measurement. The compressibility of the undersaturated oil, from the change in formation volume factor between the initial pressure and the bubble point, is 1.03 × 10⁻⁵ per psi, a typical value for a light oil with this much dissolved gas. The reservoir oil density from the PVT data, 40.9 lb/ft³, is 2.0 percent below the 41.7 lb/ft³ from the pressure gradient, which is within the combined uncertainty of the gradient fit and the separator adjustment.
Undersaturation and what it means
The most important single fact in the PVT report is the gap between the initial pressure and the bubble point: nearly 3,000 psi. The reservoir can lose half its pressure before any gas comes out of solution in the rock. Above the bubble point, production is driven only by the expansion of the oil, the connate water and the pore volume, plus whatever the aquifer supplies. Those expansions are small: the total compressibility is only about 16 millionths per psi, so without aquifer support the pressure falls quickly as oil is produced. Below the bubble point, the oil gives up its gas, the gas expands and drives production for a while, but the gas also becomes mobile, the producing gas-oil ratio climbs, and the reservoir's energy is spent quickly. Solution-gas drive in a reservoir like this typically recovers 15 to 25 percent of the oil in place.
Keeping the pressure above the bubble point, whether by a strong natural aquifer or by water injection, avoids all of that. It keeps the gas in solution, the oil's viscosity low and its formation volume factor high, and the producing gas-oil ratio constant, which also makes the gas handling predictable. That is why the strength of the aquifer, the subject of Lesson 6, is the central question for the development plan.
Worked problem
Voidage at the bubble point
A well produces 600 STB/d at a reservoir pressure of 4,800 psia, above the bubble point, where Bo = 1.495 rb/STB. How much reservoir volume is withdrawn each day, and how many barrels of water must be injected to replace it if Bw = 1.03 rb/STB?
Show solution
- Above the bubble point the produced gas is all in solution, so the voidage is the oil volume at reservoir conditions: 600 × 1.495 = 897 rb/d.
- Injected water needed at surface = 897 / 1.03 = 871 bbl/d.
Answer: Replacing the voidage takes about 1.45 bbl of injected water per stock-tank barrel. Below the bubble point the free gas produced would add to the voidage and the ratio would rise.
Sour fluids
Hydrogen sulfide changes the engineering of every part of the system. Steels exposed to wet H₂S can suffer sulfide stress cracking, a brittle failure under tensile stress, and the standard for materials in sour service, NACE MR0175/ISO 15156, applies when the partial pressure of H₂S in the gas exceeds 0.3 kPa (0.05 psia) and the system contains free water. At Spruce Ridge the partial pressure in the gas at the bubble point is hundreds of times that threshold, as the last line of the output shows, so the casing, tubing, wellheads, flowlines, vessels and valves must all be sour-service materials. That adds cost but is routine in the region.
H₂S also determines how the gas can be handled. It cannot be vented, and flaring it produces sulfur dioxide, so the gas must eventually be gathered and sent to a plant that can remove the H₂S and recover it as elemental sulfur. North Dakota's rules require operators of wells and facilities producing sour gas to have H₂S contingency planning and warning signs, and the federal OSHA standards govern workers' exposure. Lessons 9 and 11 take this further.
Two other fluid properties matter for facilities. The wax appearance temperature is the temperature at which wax crystals start to form in the oil as it cools. Oil flowing to a battery in a buried line in winter will cool toward the ground temperature, which is below the wax appearance temperature, so wax may deposit on the pipe wall unless the line is insulated or pigged regularly. The pour point is well below any temperature the oil will see in the pipeline, so the oil will not gel. Hannah notes both in the facility design basis.
Common mistakes
MistakeUsing correlations instead of the laboratory data when good samples exist.
InsteadUse correlations to check the laboratory data, not to replace them.
MistakeMixing differential liberation and separator-flash formation volume factors.
InsteadAdjust the differential data to the field's separator conditions and use one consistent set.
MistakeIgnoring the gap between initial pressure and bubble point.
InsteadRecognize that undersaturated oil has very little expansion energy and that pressure maintenance decides the recovery.
MistakeTreating H₂S as a gas plant problem only.
InsteadSour service affects materials, emergency planning, gas handling and stakeholder engagement for the whole project.
Summary and key terms
- The Spruce Ridge oil is a light, strongly undersaturated black oil with a sour solution gas.
- Constant composition expansion gives the bubble point and compressibility; differential liberation gives Rs and Bo below the bubble point; separator tests give the surface yields.
- Laboratory data should be checked for internal consistency, against a correlation such as Standing's, and against the field pressure gradient.
- Above the bubble point, production is driven by small expansions and the aquifer; below it, solution-gas drive recovers relatively little.
- Sour service under NACE MR0175/ISO 15156 applies above an H₂S partial pressure of 0.3 kPa (0.05 psia) with free water.
- Wax appearance temperature and pour point matter for pipelines and facilities.
- Black oil
- An oil whose behavior can be described by Rs, Bo and Bg as functions of pressure without a compositional model.
- Constant composition expansion
- A laboratory test that expands a sample at constant composition to find the bubble point and compressibility.
- Differential liberation
- A laboratory test that removes the liberated gas at each pressure step.
- Undersaturated oil
- Oil at a pressure above its bubble point, holding all its gas in solution.
- Sulfide stress cracking
- Brittle cracking of steel under tensile stress in wet hydrogen sulfide environments.
- Wax appearance temperature
- The temperature at which wax crystals first form as oil cools.
Practice problems
Work each problem on paper first, then reveal the answer to check.
Why does the oil compressibility above the bubble point matter so much at Spruce Ridge?
Show answer
Without a strong aquifer, the small expansion of the oil and rock is the only energy driving production, so pressure falls quickly.
What is the H₂S partial pressure in a gas with 1.5 mole percent H₂S at 1,500 psia?
Show answer
0.015 × 1,500 = 22.5 psia.
Why are differential liberation data adjusted to separator conditions?
Show answer
The surface facilities will flash the oil through separators, which gives different yields from the differential path.
What problem can a wax appearance temperature above the ground temperature cause?
Show answer
Wax deposition in buried pipelines as the oil cools.
Lesson quiz · 5 questions
Score 60% or more to complete this lesson.
Create a free account to save your progress, take quizzes and earn a certificate.