
PET-499 · Lesson 2 of 12 · 22 min
Data review and quality control
The data room holds more than four thousand files: seismic volumes and interpretation projects, well logs in several formats, core descriptions and laboratory reports, drilling reports, formation pressure surveys, fluid sample reports, the extended test records and a folder of regulatory filings. Connor's first instinct is to start mapping. Ethan stops him. “Before you interpret anything, find out what you actually have, where it came from and whether it is any good. Most bad development decisions I have seen were built on a number nobody checked.” This lesson covers how the team reviews the data, how it checks the formation pressures and test records, and how it turns what is missing into a data acquisition plan for the define stage.
A data inventory
The team's first deliverable is a data inventory: a table listing each data type, the wells or areas it covers, its source and date, its format, who checked it, and a quality rating. The ratings are simple: good, usable with corrections, or unreliable. A data inventory sounds clerical, but it does three things. It shows the gaps, such as a well with no density log over part of the reef or a fluid sample from only one well. It records the provenance of every number used later, which is what auditors and regulators ask about. And it forces the team to open every file, which is how problems are found.
| Data type | Coverage | Main checks |
|---|---|---|
| 3D seismic and interpretation | Survey over the structure | Velocity model, depth conversion, tie to the two wells |
| Open-hole logs | Both wells | Depth reference, borehole conditions, calibration, depth matching between runs |
| Core and core analysis | Discovery well, part of the reef | Core-to-log depth shift, sample selection, overburden correction |
| Formation pressure tests | Both wells | Probe seal, stabilization, mobility, supercharging |
| Fluid samples and PVT | Discovery well | Sample type and validity, contamination, opening pressure vs bubble point |
| Extended test | Discovery well | Meter calibration, tank reconciliation, gauge depth and drift, shut-in data |
| Drilling and completion reports | Both wells | Losses, kicks, cement, perforation depths, stimulation |
Depths and datums
Every depth in the data room must be put on one reference before anything else is done, because a small depth error at the oil-water contact turns into a large error in oil in place. Logs are recorded in measured depth along the hole from the kelly bushing or rotary table of the drilling rig. Maps are made in true vertical depth, usually below sea level (subsea). Converting needs the elevation of the kelly bushing above sea level, which is different for each well and each rig, and a directional survey for any well that is not vertical. Both Spruce Ridge wells are nearly vertical, but the 2-9 well was drilled with a different rig whose kelly bushing was higher.
The team also chooses a datum depth for pressures, the depth to which every pressure is referred when comparing wells or times. It chooses 13,000 ft true vertical depth below the discovery well's kelly bushing, close to the middle of the oil column. In this course depths are quoted below the 1-9 kelly bushing unless stated otherwise; the master data sheet records the subsea equivalents.
Worked problem
Putting two wells on one depth reference
The 1-9 kelly bushing is 2,348 ft above sea level. The 2-9 kelly bushing is 2,334 ft above sea level. A log in 2-9 shows the top of the water leg at 13,030 ft measured depth from its own kelly bushing. Find the depth subsea and the equivalent depth below the 1-9 kelly bushing.
Show solution
- Subsea depth = 13,030 − 2,334 = 10,696 ft below sea level.
- Depth below the 1-9 kelly bushing = 10,696 + 2,348 = 13,044 ft.
- Using the 2-9 log depth directly would put the contact 14 ft too shallow.
Answer: The water leg starts at 10,696 ft subsea, or 13,044 ft on the discovery well's reference, the same as the free water level found from the pressures below. A 14 ft error over a structure of about 550 acres would change the gross rock volume by about 7,600 acre-feet.
Formation pressure tests
A wireline formation tester measures pressure at chosen depths by pressing a probe against the borehole wall, withdrawing a small volume of fluid, and recording the pressure as it builds back up. A good test reaches a stable pressure that equals the formation pressure at that depth. Plotted against true vertical depth, good tests in a connected reservoir fall on straight lines whose slopes are the fluid gradients: about 6.5 kPa/m (0.29 psi/ft) for this light, gas-rich oil and about 10.4 kPa/m (0.47 psi/ft) for the saline formation water. The intersection of the oil and water lines is the free water level, the depth at which the capillary pressure between oil and water is zero.
Not every test is good. Tests in tight rock may not stabilize within the time allowed. Tests in low-permeability rock invaded by mud filtrate may be supercharged: the filtrate leaking from the borehole raises the pressure near the wellbore above the true formation pressure, so the test reads high. A quick indicator of reliability is the drawdown mobility, the permeability-to-viscosity ratio estimated from the drawdown part of the test. Tests with a mobility below about 1 mD/cP should be treated with suspicion. Lost seals, where the probe fails to isolate the formation and reads the mud pressure instead, are usually obvious because they read the mud hydrostatic pressure.
Connor and Mateo review the eleven pressure tests from the two wells. Ten have mobilities between 45 and 210 mD/cP and stable buildups. One test, near the base of the oil column in the discovery well, has a mobility of 0.3 mD/cP and an incomplete buildup, and it plots well to the right of the others. It was taken in a tight zone that the logs show as a dense layer. They reject it, fit the oil and water gradients to the remaining points, and find the free water level.
# Quality control of formation pressure points: reject unreliable tests, fit fluid gradients, find the free water level.
SI = False     # True: Canadian case (m, kPa), False: US case (ft, psi)
if SI:
    g, du, pu = 0.00980665, "m", "kPa"          # kPa per m for a density of 1 kg/m3
    # well, depth, pressure, mobility (mD/cP), fluid from sample or log
    pts = [("14-09", 3050.5, 30598, 210, "oil"), ("14-09", 3058.0, 30639, 95, "oil"),
           ("14-09", 3066.5, 30701, 160, "oil"), ("14-09", 3079.0, 30776, 120, "oil"),
           ("14-09", 3087.5, 31046, 0.3, "oil"), ("06-09", 3094.0, 30879, 75, "oil"),
           ("06-09", 3108.5, 30967, 140, "oil"), ("06-09", 3121.0, 31073, 180, "water"),
           ("06-09", 3129.5, 31158, 90, "water"), ("06-09", 3141.0, 31283, 60, "water"),
           ("06-09", 3152.0, 31394, 110, "water")]
else:
    g, du, pu = 0.00694444, "ft", "psi"         # psi per ft for a density of 1 lb/ft3
    pts = [("1-9", 12955, 6037.1, 180, "oil"), ("1-9", 12968, 6040.5, 75, "oil"),
           ("1-9", 12982, 6045.0, 130, "oil"), ("1-9", 12996, 6048.6, 95, "oil"),
           ("1-9", 13004, 6086.0, 0.2, "oil"), ("2-9", 13021, 6056.3, 60, "oil"),
           ("2-9", 13036, 6060.3, 110, "oil"), ("2-9", 13052, 6066.5, 150, "water"),
           ("2-9", 13066, 6072.8, 70, "water"), ("2-9", 13083, 6081.1, 45, "water"),
           ("2-9", 13098, 6087.9, 90, "water")]

def fit(xy):                                     # least-squares line p = a + b * depth
    n = len(xy); mx = sum(x for x, _ in xy) / n; my = sum(y for _, y in xy) / n
    b = sum((x - mx) * (y - my) for x, y in xy) / sum((x - mx) ** 2 for x, _ in xy)
    return my - b * mx, b

good = [p for p in pts if p[3] >= 1.0]           # tests with very low mobility are often supercharged
for p in pts:
    if p[3] < 1.0: print(f"rejected {p[0]} at {p[1]:,} {du}: mobility {p[3]} mD/cP (tight test, likely supercharged)")
lines = {}
for fl in ("oil", "water"):
    xy = [(d, pr) for _, d, pr, _, f in good if f == fl]
    a, b = fit(xy); lines[fl] = (a, b)
    worst = max(abs(pr - (a + b * d)) for d, pr in xy)
    print(f"{fl:5s}: {len(xy)} points, gradient {b:.4f} {pu}/{du}, density {b / g:,.1f} {'kg/m3' if SI else 'lb/ft3'}, worst residual {worst:.1f} {pu}")
(ao, bo), (aw, bw) = lines["oil"], lines["water"]
fwl = (ao - aw) / (bw - bo)
print(f"free water level from the gradient intersection: {fwl:,.1f} {du}")
datum = 3090.0 if SI else 13000.0
print(f"initial pressure at the datum ({datum:,.0f} {du}): {ao + bo * datum:,.0f} {pu}")
# What if the supercharged point had been kept?
xy = [(d, pr) for _, d, pr, _, f in pts if f == "oil"]
a2, b2 = fit(xy)
print(f"with the tight test kept: oil gradient {b2:.4f} {pu}/{du} and free water level {(a2 - aw) / (bw - b2):,.1f} {du}")rejected 1-9 at 13,004 ft: mobility 0.2 mD/cP (tight test, likely supercharged) oil : 6 points, gradient 0.2893 psi/ft, density 41.7 lb/ft3, worst residual 0.2 psi water: 4 points, gradient 0.4680 psi/ft, density 67.4 lb/ft3, worst residual 0.2 psi free water level from the gradient intersection: 13,044.2 ft initial pressure at the datum (13,000 ft): 6,050 psi with the tight test kept: oil gradient 0.3559 psi/ft and free water level 13,118.1 ft
The oil gradient is 0.289 psi/ft, which corresponds to a reservoir oil density of 41.7 lb/ft³, and the water gradient is 0.468 psi/ft, a brine density of 67.4 lb/ft³. The worst residual in either line is 0.2 psi, which is consistent with the gauge resolution and confirms that both wells are in one pressure system. The free water level is at 13,044 ft, and the initial pressure at the 13,000 ft datum is 6,050 psi. The last line shows the cost of keeping the bad point: the oil gradient would rise to 0.356 psi/ft, a density no light oil can have, and the free water level would move 74 ft deeper, nearly doubling the oil column. That check alone justifies the review.
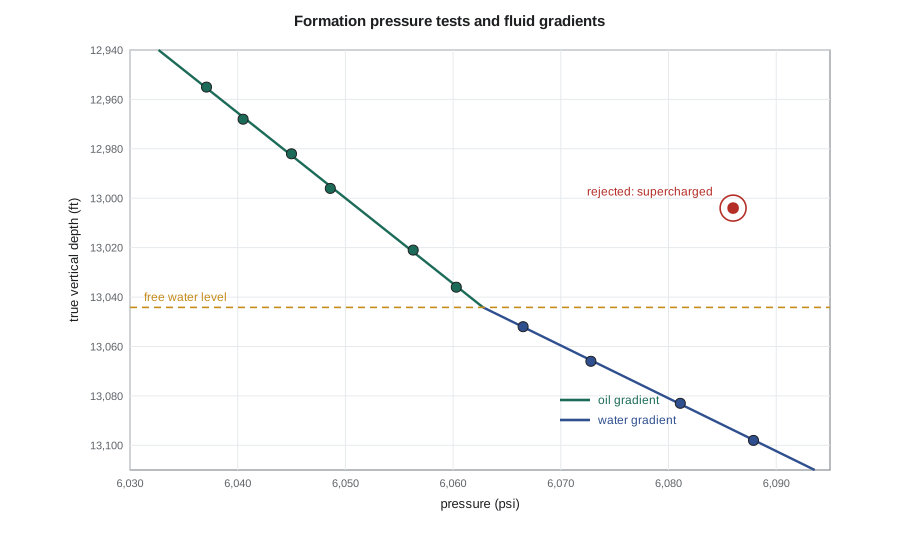
The free water level is not quite the same as the oil-water contact seen on logs. Above the free water level the rock holds a capillary transition zone in which water saturation falls with height. In a coarse, vuggy dolomite the transition is short, a meter or two, and the logs in the 2-9 well show it clearly. In tighter rock it can be tens of meters. For the volumetrics, the team uses the free water level from the pressure data as the base of the oil column and lets the saturation model handle the transition, rather than picking a contact from the logs alone.
The fluid samples
A fluid sample is useful only if it represents the reservoir fluid. Mei Lin, who supervised the sampling, walks the team through the checks. The bottomhole samples were taken with the well flowing at a low rate, so that the pressure at the sampling point stayed above the bubble point and no gas came out of solution before the sample was captured. The samplers' opening pressures in the lab matched the expected reservoir conditions, showing the chambers had not leaked. Two of the three samples gave the same bubble point within 1 percent; the third was contaminated with drilling fluid filtrate and was set aside. A separator sample pair from the extended test, recombined at the measured gas-oil ratio, gave a consistent result.
The most important check is simple: the measured bubble point must be below the reservoir pressure at the sampling depth. If a sample's bubble point equals the reservoir pressure, the oil may be saturated, with a gas cap somewhere, or the sample may have captured free gas. At Spruce Ridge the bubble point is far below the initial pressure, the oil is strongly undersaturated, and the structure has no gas cap. That fact shapes the development options, because the reservoir can lose a great deal of pressure before gas comes out of solution in the rock.
The extended test records
The four months of extended test production are the only dynamic data the team has, and they will carry the history match in Lesson 6. Hannah checks them line by line. Daily oil volumes come from a test separator meter; the oil went to tanks and was trucked to a terminal, so the meter readings can be reconciled with the tank gauges and the trucking tickets. Over the test, the trucked volume was 1.6 percent lower than the metered volume after correcting for temperature and shrinkage, which is within normal meter tolerance, and the team adopts the trucked volumes as the record of production. Gas was metered with an orifice meter whose plate size was changed partway through the test; the records before and after the change agree when corrected, but the team notes the change in the inventory.
The downhole gauge raises a different question. A memory gauge hung just above the perforations recorded pressure every minute throughout the test and the shut-in. Mateo converts the gauge pressures to the datum using the oil gradient and checks for drift by comparing the gauge with a second gauge run at the start and end of the test. The two agree within 7 kPa (1 psi), so drift is small. The pressures that matter for the material balance are average reservoir pressures, not flowing pressures, so he uses a pressure-transient model fitted to the flowing data and a short buildup in the middle of the test to estimate the average reservoir pressure at the end of each month. Those monthly average pressures, and the two months of recovery after shut-in, are the history the tank model must match.
From gaps to a data acquisition plan
The review finds the data good enough to proceed and identifies what is missing. There is no core from the 2-9 well, so the porosity model on the flank relies on logs alone. There is only one good fluid sample location. The extended test lasted four months, enough to see the aquifer start to respond but not enough to tell how large it is. And there is no water analysis good enough to design water injection. The team lists these gaps in a data acquisition plan for the define stage, each with its cost and the decision it would inform: a longer production period before the waterflood decision, a fluid sample from the first development well, a water analysis and compatibility test, and a pressure gauge left permanently in the 2-9 well to monitor the aquifer.
That last item turns out to be one of the most valuable in the plan, as Lesson 10 will show, because the decision to build water injection depends on the aquifer's strength, and the cheapest way to learn about the aquifer is to watch the pressure while the field produces.
Common mistakes
MistakeMixing measured depth, true vertical depth and depths on different kelly bushings.
InsteadConvert every depth to one reference before mapping or fitting gradients.
MistakeFitting a gradient through every pressure point.
InsteadReject tests with low mobility, failed seals or no stabilization, and check that the gradient gives a believable density.
MistakeTreating the log oil-water contact as the free water level.
InsteadUse the pressure-derived free water level as the base of the column and model the capillary transition above it.
MistakeUsing metered test volumes without reconciliation.
InsteadReconcile meters with tank gauges and sales tickets and record the corrections.
Summary and key terms
- A data inventory records the coverage, source, format and quality of every data type and shows the gaps.
- All depths must be put on one true vertical depth reference before mapping, and pressures referred to one datum.
- Good formation pressure tests define fluid gradients; low-mobility tests are often supercharged and must be rejected.
- The intersection of the oil and water gradients gives the free water level, which sits below the log contact by the height of the capillary transition.
- Fluid samples must be representative: sampled above the bubble point, free of contamination and consistent with each other.
- Test production data must be reconciled; missing information becomes a costed data acquisition plan.
- Kelly bushing (KB)
- The reference point on the drilling rig from which measured depths are recorded.
- True vertical depth (TVD)
- Depth measured vertically, used for maps and pressure gradients.
- Supercharging
- Elevated pressure near the wellbore caused by filtrate invasion, making a formation test read high.
- Drawdown mobility
- Permeability divided by viscosity, estimated from the drawdown part of a formation pressure test.
- Free water level (FWL)
- The depth at which oil and water pressures are equal and capillary pressure is zero.
- Data acquisition plan
- A costed list of the data to be gathered in the next stage, with the decision each item informs.
Practice problems
Work each problem on paper first, then reveal the answer to check.
Why are formation pressure tests with very low mobility often rejected?
Show answer
They may not stabilize and are prone to supercharging, so they can read above the true formation pressure.
An oil gradient of 0.29 psi/ft corresponds to what oil density?
Show answer
0.29 / 0.006944 ≈ 41.8 lb/ft³.
What does a measured bubble point equal to the reservoir pressure suggest?
Show answer
The oil may be saturated with a gas cap, or the sample may contain free gas.
Why is the free water level used rather than the log contact as the base of the oil column?
Show answer
The log contact sits above the free water level by the capillary transition, which the saturation model should handle.
Lesson quiz · 5 questions
Score 60% or more to complete this lesson.
Create a free account to save your progress, take quizzes and earn a certificate.