
PET-210 · Lesson 5 of 12 · 19 min
Source rocks and organic geochemistry
Reservoirs and traps are useless without oil to fill them. In the Williston Basin the source rocks are not a distant kitchen but the upper and lower shales of the Bakken itself, and the question for Prairie Crest's new acreage is how mature those shales are. Nadia sends samples from several wells to a geochemistry laboratory. The results come back as a table of numbers: total organic carbon, hydrogen index, Tmax, vitrinite reflectance. 'These tell us three things,' she explains to Ethan. 'How much organic matter the rock has, what kind it is, and how hot it has been. Get those right and we know whether the kitchen cooked anything, and whether it made oil or gas.' This lesson explains how source rocks form and how geochemists measure them.
Making and preserving organic matter
Every year, plants and algae on Earth fix enormous amounts of carbon by photosynthesis, but nearly all of it is eaten, decayed or oxidized back to carbon dioxide. Only a tiny fraction, usually much less than one percent, is buried and preserved in sediment. A source rock forms where that fraction is unusually high, which needs three conditions together: high biological productivity, so that plenty of organic matter rains down; poor oxygen at the sea or lake floor, so that animals and bacteria cannot consume it; and fine-grained sediment arriving slowly enough not to dilute the organic matter but fast enough to bury it.
These conditions occur in several settings. Upwelling zones along continental margins bring nutrients to the surface and feed dense plankton blooms. Restricted basins and silled seas, where a shallow barrier stops deep water from mixing, develop stagnant, oxygen-free bottom water. Large lakes in rift valleys can stratify, with warm surface water floating on cold, oxygen-poor deep water. Periods of global warmth and high sea level, such as parts of the Late Devonian and the mid-Cretaceous, produced widespread oceanic anoxic events when source rocks formed across many basins at once.
Kerogen types
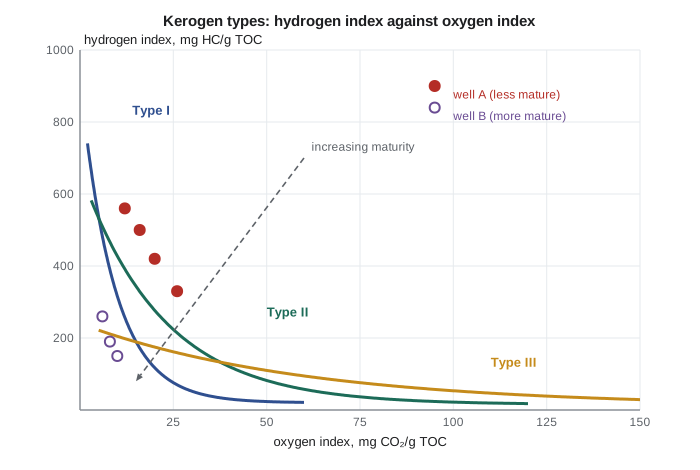
The organic matter in a source rock is mostly kerogen, the solid, insoluble material that remains after the original biological molecules have been altered during early burial. A smaller part, called bitumen, is soluble in organic solvents. Geochemists classify kerogen into types according to its origin and chemistry, especially its ratios of hydrogen and oxygen to carbon. Hydrogen-rich kerogen yields more oil when heated, because oil molecules contain about two hydrogen atoms for every carbon atom.
| Kerogen type | Main origin | H/C ratio | Main products | Typical settings |
|---|---|---|---|---|
| Type I | Lake algae and bacteria | High, about 1.5 or more | Mostly oil, high yield | Large stratified lakes |
| Type II | Marine plankton and bacteria | Intermediate, about 1.2 to 1.5 | Oil and gas | Marine shales and carbonates |
| Type II-S | Marine, sulfur-rich | Intermediate | Oil generated early at lower temperature | Carbonate and evaporite basins |
| Type III | Woody land plants | Low, below about 1.0 | Mostly gas | Deltas, coal measures |
| Type IV | Oxidized or reworked matter | Very low | Little or none | Weathered or oxidized sediments |
Measuring a source rock
Three questions define a source rock: quantity, quality and maturity. Quantity is measured as total organic carbon (TOC), the weight percent of organic carbon in the rock. Shales with less than about 0.5 percent TOC are poor; 1 to 2 percent is good; above 2 percent is very good; and some of the richest source rocks exceed 10 percent. TOC alone is not enough, because some organic matter, such as charcoal, is inert and generates nothing.
Quality and remaining potential come mostly from Rock-Eval pyrolysis, a standard laboratory test in which a powdered sample is heated in stages in an inert atmosphere. The S1 peak measures free hydrocarbons already present in the rock. The S2 peak measures hydrocarbons released by cracking the kerogen, the rock's remaining potential to generate. S3 measures carbon dioxide from oxygen-bearing organic matter. Dividing S2 by TOC gives the hydrogen index (HI), in milligrams of hydrocarbon per gram of organic carbon: values above about 600 suggest Type I, 300 to 600 Type II, and below 200 mainly gas-prone Type III or spent kerogen. The temperature of the S2 peak maximum, Tmax, rises as the kerogen matures.
The production index PI, the fraction of the total that has already been generated, also rises with maturity. Geochemists plot HI against Tmax to show kerogen type and maturity on a single chart. They also examine the kerogen under the microscope, identifying the organic particles, called macerals, much as a petrographer identifies minerals.
Maturity and the oil window
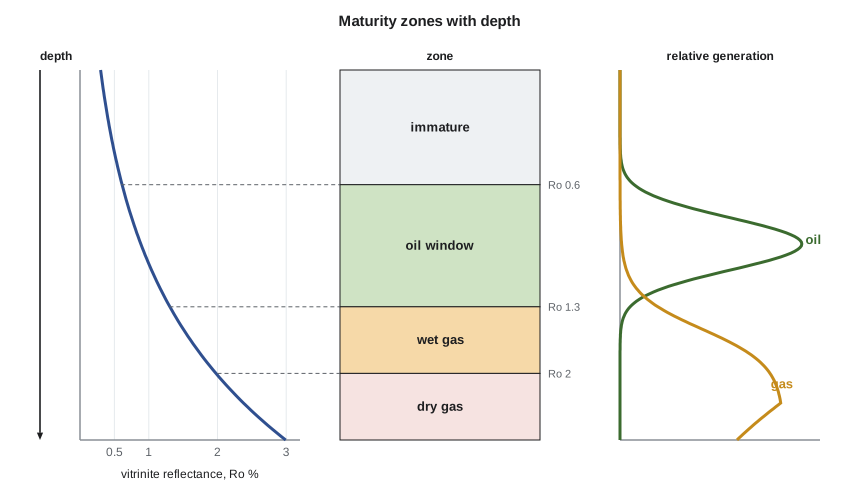
As a source rock is buried and heated, its kerogen passes through three stages. During diagenesis, at temperatures up to about 50 to 60 °C, bacteria and mild chemical changes produce biogenic methane and alter the kerogen. During catagenesis, from about 60 to 150 °C, the kerogen cracks thermally into oil and then wet gas; this is the oil window introduced in PET-200. During metagenesis, above about 150 to 200 °C, remaining kerogen and oil crack to dry gas and the residue approaches graphite. The exact temperatures depend on the kerogen type and the heating rate: generation is a chemical reaction whose rate rises exponentially with temperature, so time matters as well as temperature.
The most widely used maturity measurement is vitrinite reflectance, Ro, the percentage of light reflected from polished particles of vitrinite, a maceral derived from woody tissue. Vitrinite becomes shinier as it is heated, and the change is irreversible, so Ro records the maximum temperature the rock has reached. Roughly, Ro below 0.5 to 0.6 percent is immature; 0.6 to 1.3 percent is the oil window, with peak generation near 0.8 to 1.0 percent; 1.3 to 2.0 percent is the wet gas and condensate window; and above about 2.0 percent is dry gas. Where vitrinite is absent, as in many marine carbonates and pre-Devonian rocks, geochemists use Tmax, biomarker ratios or the color of spores and conodonts instead.
Time and temperature: the TTI method
Because generation depends on both temperature and time, geologists need a way to combine the two. In 1971 the Soviet geologist N. V. Lopatin proposed a simple method that Douglas Waples later popularized in North America. It assumes that the rate of maturation doubles for every 10 °C rise in temperature. The burial history of a source rock is divided into intervals during which its temperature fell within each 10 °C band, and each interval contributes its duration in millions of years multiplied by a factor of two raised to a power that increases by one for each band. The sum is the time-temperature index, TTI.
Waples calibrated TTI against measured vitrinite reflectance and found that oil generation typically begins near TTI 15 (Ro about 0.65 percent), peaks near TTI 75 (Ro about 1.0 percent) and ends near TTI 160 (Ro about 1.3 percent), with wet gas preserved up to about TTI 1,500. Modern basin models, discussed in Lesson 11, use more rigorous chemical kinetics, but the TTI method still shows clearly why a cool, long-buried source rock and a hot, briefly buried one can reach the same maturity.
# Lopatin-style time-temperature index (TTI) for a source rock buried at a steady rate
T_SURFACE = 10.0          # deg C
START, END = 360.0, 0.0   # source rock deposited 360 Ma; present day
STEP = 0.5                # million years per step

def depth_km(age):
    # simple history: slow burial, faster burial from 120 Ma, no uplift
    if age > 120: return 2.4 * (START - age) / (START - 120)
    return 2.4 + 1.0 * (120 - age) / 120

def tti(gradient):
    total, onset = 0.0, None
    age = START
    while age > END:
        T = T_SURFACE + gradient * depth_km(age - STEP / 2)
        n = int((T - 100) // 10)          # n = 0 for 100-110 C, -1 for 90-100 C, ...
        total += STEP * 2.0 ** n
        if onset is None and total >= 15: onset = age
        age -= STEP
    return total, onset

for g in (25, 28, 32):
    total, onset = tti(g)
    T_now = T_SURFACE + g * depth_km(0)
    stage = ("immature" if total < 15 else "oil window" if total < 160 else
             "wet gas" if total < 1500 else "dry gas")
    when = f"oil generation began about {onset:.0f} Ma" if onset else "no oil generated yet"
print(f"gradient {g} C/km: present temperature {T_now:.0f} C, TTI = {total:7.1f} ({stage}); {when}")gradient 25 C/km: present temperature 95 C, TTI = 34.9 (oil window); oil generation began about 56 Ma gradient 28 C/km: present temperature 105 C, TTI = 63.6 (oil window); oil generation began about 84 Ma gradient 32 C/km: present temperature 119 C, TTI = 138.4 (oil window); oil generation began about 112 Ma
The program follows a source rock through a burial history with a steady geothermal gradient. Most of the TTI accumulates during the last and hottest part of the history, which is why the timing of maximum burial is so important. Changing the gradient by only a few degrees per kilometer shifts the onset of generation by tens of millions of years, which can decide whether oil was generated before or after a trap formed.
Worked problem
Interpreting Rock-Eval data
A sample of upper Bakken shale from a well east of Watford City gives TOC = 11.5 percent, S1 = 7.9 mg/g, S2 = 32.2 mg/g and Tmax = 445 °C. Calculate HI and PI and interpret the sample.
Show solution
- HI = 100 × S2/TOC = 100 × 32.2/11.5 = 280 mg HC/g TOC.
- PI = S1/(S1 + S2) = 7.9/(7.9 + 32.2) = 0.20.
- Tmax of 445 °C is near peak oil generation; immature Bakken shale has HI around 600, so roughly half its potential has been used.
- With excellent TOC, substantial free oil and peak-oil maturity, this location sits in the core of the oil play.
Answer: A rich, mature Type II source rock in the oil window. Mapping the same measurements across the basin shows where the shale generated oil, where it reached the gas window, and where it is still immature.
From source rock to oil type
The oil a source rock produces carries chemical fingerprints of its origin. Biomarkers are molecules, such as steranes and hopanes, inherited almost unchanged from the membranes of the organisms that made the organic matter. Their relative amounts reveal whether the source was marine or lacustrine, carbonate or shale, and how mature it was when it expelled the oil. Geochemists use these fingerprints to correlate oils with source rocks, a key step in proving a petroleum system and in deciding which source charged which field. Stable isotope ratios of carbon and the distribution of light hydrocarbons in gas add further evidence.
In the Williston Basin, oil-source correlation confirmed that much of the oil in the Madison and other conventional reservoirs came from the Bakken shales, while some came from older Ordovician sources. In the Permian Basin, oils have been traced to several source rocks, including the Woodford and Wolfcamp shales, which are now drilled directly as tight-oil reservoirs.
Source rocks as reservoirs
Since about 2005, the source rock itself has become a drilling target in many North American basins. Only part of the oil and gas a source rock generates is expelled; the rest stays in its tiny pores and adsorbed on the kerogen. Horizontal wells with multistage hydraulic fractures, described in PET-200, can recover some of it. For these plays, the geochemical measurements in this lesson become direct reservoir properties. TOC and maturity decide how much hydrocarbon is present and whether it is oil, condensate or gas. The S1 peak indicates free oil in the rock; an oil saturation index, S1 divided by TOC, above about 100 mg/g suggests oil that can be produced rather than held by the kerogen. Organic matter itself develops porosity as it matures, so the most productive gas shales are often those with high TOC and high maturity. Geochemists and engineers therefore map these properties together with brittleness and pressure to find the sweet spots of each play.
Common mistakes
MistakeUsing TOC alone to rate a source rock.
InsteadInert carbon generates nothing. Combine TOC with hydrogen index and maturity.
MistakeAssuming a low hydrogen index always means a gas-prone kerogen.
InsteadA mature or overmature Type II kerogen also has low HI because it has already generated. Check Tmax or Ro.
MistakeIgnoring time in maturity estimates.
InsteadGeneration depends on time as well as temperature; a cool rock held long enough can mature.
MistakeTreating present-day temperature as the maximum.
InsteadUplift and erosion cool rocks; vitrinite reflectance records the maximum temperature reached.
Summary and key terms
- Source rocks need high productivity, poor oxygen at the bottom and slow fine-grained sedimentation; less than one percent of organic matter is normally preserved.
- Kerogen Types I and II are oil-prone; Type III is gas-prone; Type IV is inert.
- TOC measures quantity; Rock-Eval S2 and hydrogen index measure remaining potential and type; Tmax and vitrinite reflectance measure maturity.
- The oil window corresponds roughly to Ro 0.6 to 1.3 percent; gas windows lie beyond.
- The TTI method combines time and temperature, doubling the maturation rate every 10 °C.
- Biomarkers and isotopes correlate oils with their source rocks.
- Kerogen
- Insoluble organic matter in sedimentary rock that generates petroleum when heated.
- Total organic carbon (TOC)
- The weight percent of organic carbon in a rock.
- Hydrogen index (HI)
- Rock-Eval S2 divided by TOC, an indicator of kerogen type and remaining potential.
- Tmax
- The temperature of maximum S2 release in Rock-Eval pyrolysis; it rises with maturity.
- Vitrinite reflectance (Ro)
- The reflectivity of vitrinite particles, a standard measure of thermal maturity.
- Catagenesis
- The stage of thermal cracking that generates oil and wet gas.
- Biomarker
- A molecule inherited from living organisms that fingerprints the source of an oil.
Practice problems
Work each problem on paper first, then reveal the answer to check.
A shale has TOC 2.5 percent and S2 = 15 mg/g. Calculate HI and suggest the kerogen type if the rock is immature.
Show answer
HI = 100 × 15/2.5 = 600: oil-prone Type II, near the Type I boundary.
Vitrinite reflectance in a well is 0.45 percent at the target source rock. Will it have generated significant oil?
Show answer
No; Ro 0.45 percent is immature, below the oil window.
A source rock spends 10 million years at 100 to 110 °C and 5 million years at 110 to 120 °C. What is its TTI contribution from these intervals?
Show answer
10 × 2⁰ + 5 × 2¹ = 10 + 10 = 20, past the onset of oil generation near 15.
Why can the same TOC value describe a rich source rock or a poor one?
Show answer
TOC does not distinguish reactive from inert carbon or account for maturity; hydrogen index and maturity are needed.
Lesson quiz · 5 questions
Score 60% or more to complete this lesson.
Create a free account to save your progress, take quizzes and earn a certificate.