
ELE-280 · Lesson 11 of 12 · 23 min
Data acquisition and sensors
Many measurements are too slow, too long or too numerous to read by eye. A temperature that drifts over a day, a battery voltage logged every second for a week, sixteen strain gauges sampled together during a load test: these need a data acquisition system, an instrument or circuit that converts sensor signals to numbers and records them automatically, usually under the control of a computer. This lesson follows the chain from sensor to stored number: what sensors produce, how signal conditioning prepares the signal, how the analog-to-digital converter turns it into codes, how to choose sample rate and resolution, and how to control instruments from a computer.
Cedarline's outdoor controllers must work from −40 °C in winter to well above 60 °C inside a sunlit cabinet in summer. Amara asks Leo to set up a test that logs the cabinet temperature, the 24 V rail, the LED head current and the strain on the signal arm every second for a week in the environmental chamber, while the chamber cycles through the full temperature range.
The measurement chain
A data acquisition chain has four parts. The sensor, or transducer, converts a physical quantity into an electrical one: a thermistor changes resistance with temperature, a strain gauge changes resistance with strain, a microphone produces a voltage from pressure, a Hall-effect sensor produces a voltage from magnetic field. Signal conditioning then makes that electrical quantity suitable for the converter: it excites resistive sensors, amplifies small signals, shifts their level, filters out noise and frequencies above half the sample rate, and isolates dangerous voltages. The analog-to-digital converter samples the conditioned voltage at regular intervals and quantizes each sample to a binary code. Finally, software scales the codes back into physical units, applies calibration and stores or displays the results.
Sensors and their outputs
| Sensor | Measures | Output | Notes |
|---|---|---|---|
| Thermistor (NTC) | Temperature | Resistance falling strongly with temperature | Sensitive and cheap; non-linear; needs excitation |
| RTD (platinum, Pt100 or Pt1000) | Temperature | Resistance rising almost linearly, about 0.385 %/°C | Accurate and stable; use three- or four-wire connections |
| Thermocouple | Temperature difference | Microvolts per degree from a junction of two metals | Wide range; needs cold-junction compensation and a high-gain amplifier |
| Strain gauge | Strain | Small resistance change, about 2 × strain | Used in a bridge (lesson 8) |
| Hall-effect current sensor | Current | Voltage proportional to the magnetic field of the current | Isolated; offset and drift need attention |
| Shunt resistor | Current | Voltage proportional to current | Accurate; not isolated; four-terminal for low values |
Each sensor's data sheet gives its transfer function, the relation between the physical quantity and the electrical output, along with its accuracy, range, response time and how it depends on temperature and supply. Some are nearly linear, like the RTD. Others, like the thermistor, are strongly non-linear and need a model to convert resistance to temperature. A common one is the beta model, which works well over a limited range, and the more accurate Steinhart–Hart equation relates the logarithm of resistance to the reciprocal of absolute temperature with three constants found by calibration at three temperatures.
Signal conditioning
Conditioning is where most measurement quality is won or lost. A thermistor in a divider with a fixed resistor, driven from the converter's own reference voltage, gives a ratiometric measurement: the reference's errors cancel because both the excitation and the converter's full scale come from it. A bridge output of a few millivolts needs an instrumentation amplifier, which amplifies the difference between its inputs while rejecting the voltage common to both, specified by its common-mode rejection ratio. An anti-aliasing filter ahead of the converter must remove everything above half the sample rate, or noise and interference will alias into the band of interest just as on the scope in lesson 7. When the sensor sits on a high-voltage or noisy circuit, an isolation amplifier or isolated converter breaks the galvanic connection and protects both the instrument and the operator.
The analog-to-digital converter
An N-bit converter divides its full-scale input range into 2ᴺ steps. The size of one step, the least significant bit (LSB), sets the resolution: a 12-bit converter with a 3.3 V range resolves about 0.81 mV, and a 16-bit converter about 0.05 mV. Quantization itself adds an error of up to half an LSB, which behaves like noise with an RMS value of LSB/√12. For a full-scale sine wave, this sets an ideal signal-to-noise ratio of about 6.02N + 1.76 dB. Real converters are worse because of their own noise, non-linearity and distortion, and data sheets express the result as an effective number of bits, ENOB, computed from the measured SINAD (signal to noise and distortion ratio).
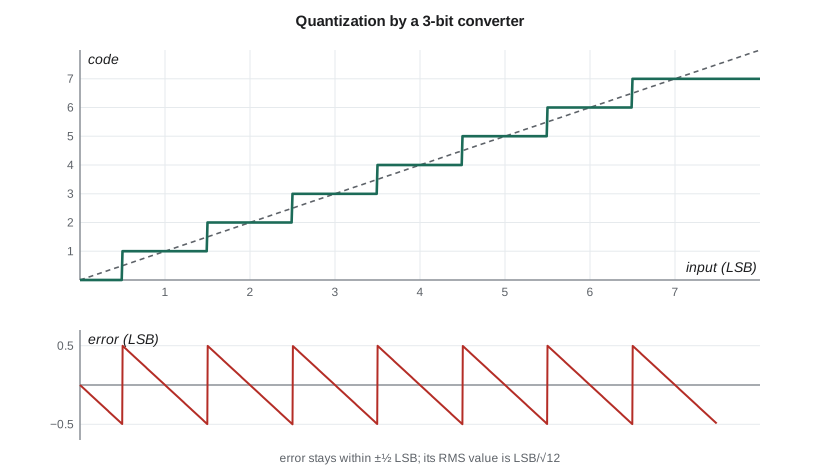
Resolution is not accuracy. A 24-bit converter in a data logger can resolve fractions of a microvolt, but its absolute accuracy is limited by its reference voltage, gain and offset errors, drift with temperature, and the sensor and conditioning in front of it. The same logic as lesson 2 applies: the extra digits matter only if every other part of the chain is good enough to use them. For slow signals such as temperature, one useful trick is averaging: averaging M samples of a signal with random noise reduces the noise by √M, so averaging sixteen samples gains about two bits of effective resolution, provided the noise is at least about an LSB so that the samples actually differ.
Worked problem
Choosing a converter for the thermistor
Leo's thermistor is a 10 kΩ NTC with β = 3950 K at 25 °C, in a divider with a 10 kΩ fixed resistor from a 3.30 V reference, measured by the controller's 12-bit ADC with a 3.30 V full scale. At 25 °C, how many ADC counts correspond to a 0.1 °C change?
Show solution
- At 25 °C the thermistor is 10 kΩ, so the divider output, taken across the fixed resistor, is 1.650 V, mid-scale.
- The beta model gives the thermistor's sensitivity at 25 °C (298.15 K): dR/dT = −βR/T² = −3950 × 10,000/298.15² ≈ −444 Ω/K.
- \[\frac{dV}{dR} = -\frac{V_{ref} R_f}{(R + R_f)^2} = -\frac{3.30 \times 10\,000}{(20\,000)^2} = -82.5\ \mu\text{V/}\Omega\]
- \[\frac{dV}{dT} = (-82.5\ \mu\text{V/}\Omega)(-444\ \Omega/\text{K}) \approx 36.6\ \text{mV/K}\]
- One LSB is 3.30 V / 4096 ≈ 0.806 mV, so 0.1 °C gives 3.66 mV, or about 4.5 LSB.
Answer: About 4.5 counts per 0.1 °C at 25 °C, so the 12-bit ADC resolves temperature to about 0.02 °C there. Resolution falls at the extremes because the divider's sensitivity drops; at −40 °C it is about six times coarser, though still finer than the thermistor's accuracy of a few tenths of a degree.
# Thermistor divider: temperature from ADC counts, and resolution across the range
import math
B, R0, T0 = 3950.0, 10e3, 298.15        # beta model constants (illustrative part)
RF, VREF, NBITS = 10e3, 3.30, 12
LSB = VREF / 2 ** NBITS

def r_therm(t_c):
    return R0 * math.exp(B * (1 / (t_c + 273.15) - 1 / T0))

def counts(t_c):
    v = VREF * RF / (r_therm(t_c) + RF)     # voltage across the fixed resistor
    return round(v / LSB)

def temp_from_counts(n):
    v = n * LSB
    r = RF * (VREF - v) / v
    return 1 / (1 / T0 + math.log(r / R0) / B) - 273.15

for t in (-40, 0, 25, 60, 85):
    n = counts(t)
    step = temp_from_counts(n + 1) - temp_from_counts(n)
    print(f"{t:4d} C: R = {r_therm(t)/1e3:8.2f} k, counts {n:4d}, "
          f"reads back {temp_from_counts(n):7.2f} C, one count = {step:.3f} C")

print(f"LSB = {LSB*1e3:.3f} mV, quantization noise = {LSB/math.sqrt(12)*1e3:.3f} mV rms, "
f"ideal SNR = {6.02*NBITS+1.76:.1f} dB")-40 C: R = 401.86 k, counts 99, reads back -40.06 C, one count = 0.142 C 0 C: R = 33.62 k, counts 939, reads back -0.00 C, one count = 0.026 C 25 C: R = 10.00 k, counts 2048, reads back 25.00 C, one count = 0.022 C 60 C: R = 2.49 k, counts 3280, reads back 59.98 C, one count = 0.043 C 85 C: R = 1.09 k, counts 3695, reads back 85.04 C, one count = 0.090 C LSB = 0.806 mV, quantization noise = 0.233 mV rms, ideal SNR = 74.0 dB
The output shows the thermistor's resistance swinging from about 400 kΩ at −40 °C to about 1 kΩ at 85 °C, and the resolution of one count growing from about 0.02 °C near room temperature to about 0.14 °C at −40 °C and 0.09 °C at 85 °C. That is the price of a simple divider with a strongly non-linear sensor. Amara accepts it for the controller, which only needs to switch a cabinet heater and fan, but for the chamber test Leo uses a data logger with a Pt1000 RTD and a 24-bit converter as the reference.
Choosing the sample rate
The sample rate must be at least twice the highest frequency present after the anti-aliasing filter, and in practice several times higher, so that the filter can roll off between the signal band and half the sample rate. For slowly changing quantities, choose the rate from the fastest change you need to see, not from the converter's maximum: a cabinet temperature changes over minutes, so one sample per second is plenty, while the LED head current changes in microseconds when a head switches, so a separate fast capture on the scope suits that. Oversampling well beyond the need and averaging in software is a common way to reduce noise. Storage adds up quickly: four channels of 16-bit samples at 1 kSa/s for a week is about 4.8 GB, but at one sample per second it is under 5 MB.
Computer-controlled instruments
Almost every modern bench instrument can be controlled from a computer, which turns a manual measurement into an automated, repeatable test. Instruments connect over USB, Ethernet (often using the LXI standard) or the older GPIB bus, and most accept text commands in a common language called SCPI, Standard Commands for Programmable Instruments. A command such as MEAS:VOLT:DC? asks a meter for a DC voltage reading, and the instrument returns a number as text. Scripts in Python or similar languages send the commands, collect the readings, timestamp them and write them to files, often through a library that hides the bus details. Leo's chamber test uses one script to set the chamber temperature profile, read the four channels from the data logger every second and append them to a file, with a flag when any reading goes out of its expected range.
Worked problem
Estimating the log size
The chamber test logs a timestamp and four channels once per second for seven days, written as text lines of about 60 characters. Estimate the file size, and compare with logging the LED current at 10 kSa/s for the same week as 2-byte binary samples.
Show solution
- Seven days is 7 × 86,400 = 604,800 seconds, so the text log has 604,800 lines.
- \[604\,800 \times 60\ \text{bytes} \approx 36\ \text{MB}\]
- \[604\,800\ \text{s} \times 10\,000\ \text{Sa/s} \times 2\ \text{bytes} \approx 12\ \text{GB}\]
Answer: About 36 MB for the slow log, which any spreadsheet or script can handle, against about 12 GB for continuous fast logging of one channel. Fast events are better captured with a triggered acquisition only when something interesting happens.
Common mistakes
MistakeSampling without an anti-aliasing filter.
InsteadFilter out content above half the sample rate before the converter; otherwise noise aliases into the band.
MistakeTreating converter resolution as system accuracy.
InsteadAccuracy depends on the reference, gain, offset, drift, sensor and conditioning, not just the number of bits.
MistakeUsing a linear formula for a thermistor.
InsteadUse the beta model over a narrow range or Steinhart–Hart with calibration constants.
MistakeChoosing the fastest sample rate available.
InsteadChoose from the fastest change you need to see; excess rate wastes storage and can still alias without filtering.
MistakeConnecting a grounded logger to a sensor on a high-voltage circuit.
InsteadUse isolation; otherwise you create a shock hazard or a short through the logger's ground.
Summary and key terms
- A data acquisition chain runs from sensor through conditioning and anti-aliasing filter to an ADC and software.
- Sensors have transfer functions; thermistors are non-linear and need models such as the beta equation or Steinhart–Hart.
- Conditioning provides excitation, gain, filtering and isolation; ratiometric measurements cancel reference errors.
- An N-bit ADC has LSB = V_FS/2ᴺ, quantization noise LSB/√12 and ideal SNR about 6.02N + 1.76 dB; ENOB describes real performance.
- Sample rate must exceed twice the highest frequency after filtering and should match the speed of the quantity measured.
- Computer-controlled instruments using SCPI over USB, LAN or GPIB make tests automatic and repeatable.
- Transducer
- A device that converts a physical quantity into an electrical signal, or the reverse.
- Signal conditioning
- Circuitry that excites, amplifies, filters, shifts or isolates a sensor signal to suit the converter.
- Least significant bit (LSB)
- The smallest step an ADC can resolve, equal to the full-scale range divided by 2ᴺ.
- Quantization error
- The difference between the input and the converter's output code, up to ±½ LSB.
- Effective number of bits (ENOB)
- The resolution an ideal converter would need to match a real converter's measured SINAD.
- Ratiometric measurement
- A measurement in which sensor excitation and converter reference come from the same source, so their errors cancel.
- SCPI
- Standard Commands for Programmable Instruments, a common text command language for controlling instruments.
Practice problems
Work each problem on paper first, then reveal the answer to check.
What is one LSB of a 16-bit converter with a 5.0 V range?
Show answer
5.0/65,536 ≈ 76 µV.
What is the ideal SNR of a 10-bit converter?
Show answer
6.02 × 10 + 1.76 ≈ 62 dB.
A converter's measured SINAD is 68 dB. Find its ENOB.
Show answer
(68 − 1.76)/6.02 ≈ 11.0 bits.
Averaging 64 samples with random noise improves resolution by how many bits, ideally?
Show answer
√64 = 8 = 2³, so about 3 bits.
Why is a thermistor divider driven from the ADC's reference called ratiometric?
Show answer
The output and the full scale both scale with the reference, so its errors cancel.
What would the SCPI query MEAS:VOLT:DC? ask a meter to do?
Show answer
Take a DC voltage reading and return it.
Lesson quiz · 5 questions
Score 60% or more to complete this lesson.
Create a free account to save your progress, take quizzes and earn a certificate.