
CMP-499 · Lesson 9 of 12 · 20 min
Verification and validation
At the end of a capstone, the client, the advisor and the examiners all ask the same question: does it work? A demonstration that the node counted a few people on demo day is not an answer. The answer is evidence that every requirement is met, gathered by planned tests with recorded results, plus evidence that the system actually solves the client's problem in its real environment. Those are two different things, and engineers give them two different names. This lesson covers how the TrailCount team planned, ran and reported both.
Verification and validation
Verification asks: did we build the system right? It checks the system against its requirements, one by one. Validation asks: did we build the right system? It checks the system against the stakeholders' needs in the intended environment. A node that meets every requirement in the laboratory can still fail validation if the requirements missed something, such as the fact that the city's planners need counts broken out by hour, not by 15 minutes, for their reports. Verification without validation risks building the wrong thing well; validation without verification risks a system that seems fine until it fails.
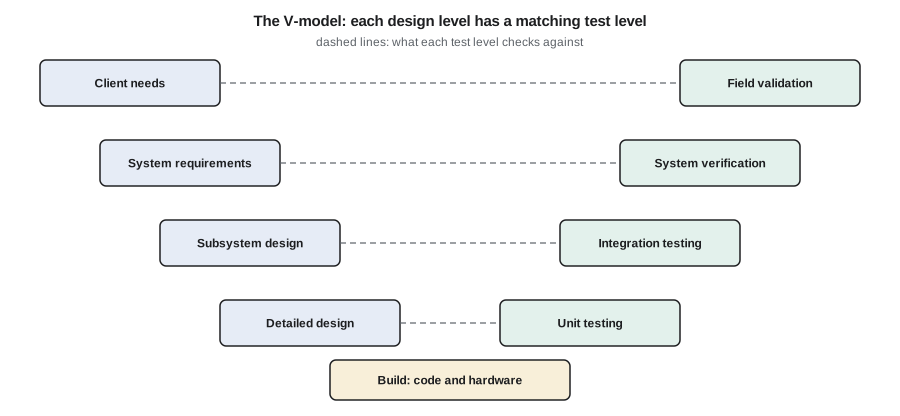
The V-model shows the relationship. Each level of design on the left has a matching level of testing on the right. Unit tests check detailed designs: the tracker function, the payload encoder, the charger circuit. Integration tests check that subsystems work together through their interfaces, against the ICDs. System verification checks the whole node against the system requirements. Field validation checks the deployed system against the client's needs. The key idea is that each test level is planned at the same time as the design level it checks, not after the build. The TrailCount verification plan was written between the PDR and the CDR, before the beta board existed.
The verification plan
A verification plan lists every requirement, its verification method from the requirements baseline, the specific test or analysis that will verify it, the pass criteria, the equipment and facilities needed, and the schedule. Each test then gets a procedure: a step-by-step document that a person other than the designer could follow, with the setup, the steps, the data to record and the pass or fail criteria. Writing procedures in advance has two benefits. It exposes requirements that are hard to test while there is still time to change them, and it prevents the temptation to adjust pass criteria after seeing the results.
| Requirement | Verification activity | Pass criterion |
|---|---|---|
| SYS-01 accuracy | FT-1: 7-day field trial against manual counts | Daily totals within 5 % for both modes |
| SYS-02 direction | LT-4: 600 staged passages at the test path | Lower 95 % bound of correct rate at least 97 % |
| SYS-03 temperature | ET-1 hot soak at +50 °C; ET-2 cold start and operation at −30 °C | Counts and uplinks continue; no resets |
| SYS-04 autonomy | AN-2 energy analysis plus a 48-hour measured drain test | Predicted autonomy at least 5 days |
| SYS-05 latency | IT-3: timestamps of 500 uplinks against dashboard arrival | All within 30 minutes of interval end |
| SYS-06 no images | IN-1: inspection of hardware and firmware | No image sensor or image data path |
| SYS-07 enclosure | ET-3: IP66 jets; ET-4: IK08 impact | No water ingress; no damage that affects function |
Testing at each level
Unit tests ran automatically on every firmware change. Amira's tracker and classifier had a test suite that replayed 40 recorded scenes from the field, each with hand-labeled ground truth, and checked the counts. When a change improved one scene and broke another, the suite showed it immediately. The payload encoder had tests generated from ICD-03, including boundary values such as counts at 65,535 and temperatures of −40 °C. On the hardware side, Keisha tested each alpha and beta board with a bring-up procedure: check every rail's voltage, check current in each mode, check each bus, check the charger's temperature cutoff with a resistor substituted for the thermistor.
Integration tests focused on the interfaces. A hardware-in-the-loop setup fed recorded radar frames into the microcontroller through the real UART at full rate, while the LoRa module sent real uplinks to Northway's network, so the team could check the whole data path from detection to dashboard without standing at the trail. Lucas checked IT-3, the latency requirement, by comparing each uplink's interval timestamp with its arrival time in Dana's database over 500 uplinks.
Environmental tests needed facilities the team did not own. The department lent a temperature chamber for ET-1 and ET-2. ET-3 used a garden hose nozzle sized to approximate the IP66 water jet, which is a pre-compliance check rather than a certified test; the team said so clearly in its report. The cold test produced the project's most important failure. At −30 °C, the radar module did not start: it reported an internal error and stayed silent until it had warmed to about −22 °C. That was ET-2's fail.
A failure found by a planned test is a success of the verification process. The team logged it, found that the module's datasheet specified operation to −40 °C but start-up only from −25 °C, a distinction the team had missed, and changed the design: the firmware now keeps the radar powered in a low-duty standby mode instead of switching it off completely in low-battery mode, and if a start-up attempt fails, it waits and retries as the heater warms the enclosure. The retest passed. The final report records both the failure and the fix, which reviewers value far more than a clean record nobody believes.
The field trial
Validation happened at the trail. Three beta nodes were mounted on posts at the counting site for two weeks. For seven of those days, pairs of student volunteers counted every passage by mode and direction in two-hour shifts covering daylight hours, using a simple tally app that never recorded images. The city's planner helped design the schedule so that it included a busy weekend, a rainy weekday and evening commute peaks.
Manual counts are themselves imperfect. Observers miss passages when two groups pass at once, and they disagree about borderline cases such as a child on a scooter. The team estimated the observers' own error by having two observers count the same shifts independently on two days; they disagreed by about 2 %, which matches what the city had seen in past surveys. That number limits how small an error the trial can resolve, as lesson 2 anticipated.
import math
# Field trial: seven days of node counts vs manual video-free counts by observers
days = ['Sat', 'Sun', 'Mon', 'Tue', 'Wed', 'Thu', 'Fri']
manual = {'ped': [412, 455, 198, 176, 221, 189, 240], 'bike': [133, 160, 71, 64, 90, 58, 85]}
node   = {'ped': [398, 437, 194, 171, 214, 186, 233], 'bike': [138, 166, 72, 63, 93, 59, 88]}
for cls in ('ped', 'bike'):
    errs = [(n - m) / m * 100 for n, m in zip(node[cls], manual[cls])]
    worst = max(errs, key=abs)
    mape = sum(abs(e) for e in errs) / len(errs)
    print(f"{cls:4s} daily error: " + ' '.join(f"{e:+5.1f}" for e in errs) + " %")
    print(f"     mean bias {sum(errs) / len(errs):+.1f} %, MAPE {mape:.1f} %, worst {worst:+.1f} %"
          f" -> SYS-01 (within 5 %): {'pass' if abs(worst) <= 5 else 'fail'}")

def wilson(k, n, z=1.96):
    p = k / n; d = 1 + z * z / n
    c = (p + z * z / (2 * n)) / d; h = z * math.sqrt(p * (1 - p) / n + z * z / (4 * n * n)) / d
    return c - h, c + h
# direction test: 600 staged passages, 591 given the right direction
lo, hi = wilson(591, 600)
print(f"\nDirection correct 591/600 = {591 / 600:.1%}, 95 % interval {lo:.1%} to {hi:.1%}")
print(f"SYS-02 target 97 %: {'pass' if lo >= 0.97 else 'not yet shown'} (lower bound {lo:.1%})")

# traceability: which requirements have a passing test?
results = {'SYS-01': ['FT-1 pass'], 'SYS-02': ['LT-4 pass'], 'SYS-03': ['ET-1 pass', 'ET-2 fail'],
           'SYS-04': ['AN-2 pass'], 'SYS-05': ['IT-3 pass'], 'SYS-06': ['IN-1 pass'], 'SYS-07': []}
for r, tests in results.items():
    state = 'no test' if not tests else 'open failure' if any('fail' in t for t in tests) else 'verified'
print(f"{r}: {state:13s} {', '.join(tests)}")ped daily error: -3.4 -4.0 -2.0 -2.8 -3.2 -1.6 -2.9 %
mean bias -2.8 %, MAPE 2.8 %, worst -4.0 % -> SYS-01 (within 5 %): pass
bike daily error: +3.8 +3.8 +1.4 -1.6 +3.3 +1.7 +3.5 %
mean bias +2.3 %, MAPE 2.7 %, worst +3.8 % -> SYS-01 (within 5 %): pass
Direction correct 591/600 = 98.5%, 95 % interval 97.2% to 99.2%
SYS-02 target 97 %: pass (lower bound 97.2%)
SYS-01: verified FT-1 pass
SYS-02: verified LT-4 pass
SYS-03: open failure ET-1 pass, ET-2 fail
SYS-04: verified AN-2 pass
SYS-05: verified IT-3 pass
SYS-06: verified IN-1 pass
SYS-07: no testThe node undercounted pedestrians by 1.6 % to 4.0 % each day and overcounted cyclists by up to 3.8 %. Both pass SYS-01, whose limit is 5 %, but the pattern matters more than the pass. The errors are systematic, not random. Pedestrians are undercounted every single day, because pairs walking close together sometimes merge into one track. Cyclists are overcounted on most days, because some runners are fast enough to look like slow cyclists. The weekly mean biases of −2.8 % and +2.3 % also meet the city's 3 % goal, but only just for pedestrians. The team recorded both effects as known limitations and as candidates for future work, with the evidence.
Worked problem
A confidence interval for a detection rate
In the staged direction test, 591 of 600 passages were given the correct direction. SYS-02 requires at least 97 %. Is the requirement met with 95 % confidence?
Show solution
- The observed rate is 591 / 600 = 98.5 %, but a finite sample gives only an estimate. A confidence interval shows the range of true rates consistent with the data.
- The Wilson score interval works well for proportions near 0 or 1. With z = 1.96:
- \[\hat p = 0.985,\quad \text{center} = \frac{\hat p + z^2/2n}{1 + z^2/n},\quad \text{half-width} = \frac{z\sqrt{\hat p(1-\hat p)/n + z^2/4n^2}}{1 + z^2/n}\]
- The script gives an interval from 97.2 % to 99.2 %.
- The lower bound, 97.2 %, is above 97 %, so the requirement is met with 95 % confidence. With only 100 staged passages and the same observed rate, the lower bound would fall well below 97 %, and the test could not show compliance.
Answer: Yes: the 95 % interval is 97.2 % to 99.2 %, and its lower bound exceeds 97 %.
This example shows why sample size belongs in the verification plan. A test that is too small cannot demonstrate a requirement even if the system meets it. The team chose 600 staged passages after a quick calculation showed that, at an expected rate of about 98.5 %, fewer than about 400 passages would leave the lower bound uncomfortably close to 97 %.
Closing the loop: the verification matrix
The last part of the script checks the traceability status of each requirement: verified if all its tests passed, an open failure if any test failed, and no test if none has been run. At the TRR, SYS-03 showed an open failure (ET-2) and SYS-07 had no result yet, because the impact test was scheduled for the following week. The team does not claim the system is verified until the matrix shows every requirement verified or explicitly waived by the client with a reason. In TrailCount's case the final matrix showed SYS-03 verified after the retest, SYS-07 verified, SYS-09 partly met and SYS-11 descoped, as lesson 12 describes.
Regression testing protects what has already been verified. Every firmware fix after the field trial was followed by a full replay of the 40-scene unit suite and a short hardware-in-the-loop run, so that fixing the cold start-up could not silently break counting. Teams that skip regression testing often discover, on demo day, that the last-minute fix broke something that worked last week.
Ethics of testing with people
Field trials involve people, and that raises ethical questions even when no personal data is collected. The team's trial recorded no images and no identities, only counts, and the volunteer observers were team members and friends who agreed to take part. Even so, Professor Osei asked the team to check with the university's research ethics office whether the activity needed review. The office confirmed that counting anonymous passers-by in a public place for a product evaluation did not require a full review, but asked the team to post a small sign explaining the trial and giving a contact email. Several trail users wrote, mostly out of curiosity, and one asked to see the data, which the city later published as open data.
Common mistakes
MistakeTreating a successful demonstration as proof that the system works.
InsteadVerify every requirement with planned tests and recorded results, and validate the system with real users in the intended environment.
MistakeWriting test procedures after the hardware arrives.
InsteadPlan verification alongside design and write procedures before testing, with pass criteria fixed in advance.
MistakeRunning tests too small to show compliance.
InsteadSize tests with a confidence interval so that a system meeting the requirement can actually demonstrate it.
MistakeHiding test failures from the report.
InsteadRecord failures, causes, fixes and retests; a managed failure is evidence of good engineering.
MistakeIgnoring systematic error because the requirement passed.
InsteadLook at the pattern of errors, explain the causes and record them as known limitations.
Summary and key terms
- Verification checks the system against its requirements; validation checks it against stakeholder needs in the real environment.
- The V-model pairs each design level with a test level, planned at the same time as the design.
- A verification plan maps each requirement to a test, analysis, inspection or demonstration with fixed pass criteria and written procedures.
- Unit, integration, environmental and field tests each find different problems; hardware-in-the-loop tests interfaces efficiently.
- Statistical tests need adequate sample sizes; a confidence interval's lower bound must clear the requirement.
- A traceability matrix shows each requirement as verified, failed or untested; regression tests protect earlier results.
- Verification
- Confirming, with objective evidence, that a system meets its specified requirements.
- Validation
- Confirming that a system meets stakeholder needs in its intended environment.
- V-model
- A development model that pairs each design level with a corresponding test level.
- Test procedure
- Step-by-step instructions for a test, with setup, data to record and pass criteria.
- Hardware-in-the-loop
- Testing real hardware with simulated or recorded inputs from the rest of the system.
- Regression testing
- Re-running earlier tests after a change to confirm nothing that worked has broken.
- Confidence interval
- A range that, with stated confidence, contains the true value of an estimated quantity.
- Systematic error
- A consistent bias in measurements, as opposed to random scatter.
Practice problems
Work each problem on paper first, then reveal the answer to check.
A node counts 214 pedestrians on a day when observers count 221. What is the daily error, and does it meet a 5 % limit?
Show answer
(214 − 221) / 221 = −3.2 %; it meets the limit.
Classify as verification or validation: checking that uplinks reach the dashboard within 30 minutes.
Show answer
Verification, because it checks a specific requirement (SYS-05).
Classify as verification or validation: the city planner uses a week of counts to prepare a report and finds the data fit for the purpose.
Show answer
Validation, because it checks the system against the stakeholder's need in practice.
Why did the team keep the radar in standby rather than powering it off in low-battery mode?
Show answer
Because the module could not start below about −25 °C; keeping it in standby avoids a cold start and the retest passed.
Lesson quiz · 5 questions
Score 60% or more to complete this lesson.
Create a free account to save your progress, take quizzes and earn a certificate.