
CMP-499 · Lesson 7 of 12 · 21 min
Schedule, budget and earned value
A capstone has a fixed end date that no amount of engineering brilliance can move. Demo day happens whether or not the system works. The TrailCount team therefore had to manage time as carefully as it managed power. This lesson covers the tools the team used: a work breakdown structure, a network schedule with its critical path, a Gantt chart, a parts and money budget, and earned value management, which combines schedule and cost into one honest picture of progress.
The work breakdown structure
A work breakdown structure (WBS) divides the total scope of the project into deliverable-oriented pieces, level by level, until each piece is small enough to estimate and assign. The top level for TrailCount had the seven work packages from lesson 1. Under firmware and power modes, for example, sat drivers, tracker, classifier, counter and storage, power manager, radio stack integration, and firmware tests. The rule of thumb is that the lowest-level tasks should take between about one day and two weeks of effort: shorter tasks are micromanagement, and longer ones hide trouble.
Two properties make a WBS useful. It is complete: the 100 % rule says the children of each element add up to exactly the parent's scope, no more and no less, so nothing is forgotten and nothing is done twice. And it is organized by deliverables, not by people or phases, so that each element produces something that can be checked, such as a working driver, a test report or a reviewed schematic. Documentation, reviews and testing belong in the WBS; teams that leave them out are always surprised by how long they take.
Dependencies and the critical path
Tasks depend on each other. The beta board cannot be assembled until it is fabricated, and it cannot be fabricated until it is laid out. Integration needs the board, the parts and the firmware. A network schedule records these dependencies, and the critical path method (CPM) finds the longest chain of dependent tasks from start to finish. That chain sets the project's length. Any delay on it delays the whole project; tasks off it have float, also called slack, which is the delay they can absorb without moving the end date.
CPM uses two passes through the network. The forward pass computes each task's earliest start (ES) and earliest finish (EF = ES + duration): a task can start as soon as all its predecessors finish. The backward pass starts from the project end and computes each task's latest finish (LF) and latest start (LS = LF − duration): a task must finish before any successor needs to start. Float is LS − ES. Tasks with zero float form the critical path.
# Critical path (CPM) for the winter term, durations in weeks
tasks = {  # name: (duration, predecessors)
    'A Order beta parts':      (3, []),
    'B Beta PCB layout':       (2, []),
    'C Beta PCB fab + build':  (3, ['B']),
    'D Classifier firmware':   (5, []),
    'E Power-mode firmware':   (3, []),
    'F Integrate beta node':   (2, ['A', 'C', 'D', 'E']),
    'G Lab verification':      (2, ['F']),
    'H Field trial (2 weeks)': (2, ['G']),
    'I Final report':          (3, ['G']),
    'J Demo day prep':         (1, ['H', 'I']),
}
key = {n[0]: n for n in tasks}
es, ef = {}, {}
for n, (d, pre) in tasks.items():            # listed in a valid order
    es[n] = max((ef[key[p]] for p in pre), default=0); ef[n] = es[n] + d
end = max(ef.values())
lf, ls = {}, {}
for n in reversed(list(tasks)):
    succ = [m for m, (_, pre) in tasks.items() if n[0] in pre]
    lf[n] = min((ls[m] for m in succ), default=end); ls[n] = lf[n] - tasks[n][0]
print(f"Project length: {end} weeks")
for n in tasks:
    fl = ls[n] - es[n]
    print(f"{n:24s} ES {es[n]:2d} EF {ef[n]:2d} LS {ls[n]:2d} LF {lf[n]:2d} float {fl}{'  critical' if fl == 0 else ''}")

# Earned value at the end of week 6 (budget in person-hours)
BAC = 420                       # budget at completion for the winter term
PV, EV, AC = 190, 162, 205      # planned value, earned value, actual cost to date
CPI, SPI = EV / AC, EV / PV
EAC = BAC / CPI
print(f"\nCV {EV - AC:+d} h, SV {EV - PV:+d} h, CPI {CPI:.2f}, SPI {SPI:.2f}")
print(f"EAC = BAC / CPI = {EAC:.0f} h (overrun {EAC - BAC:.0f} h), ETC {EAC - AC:.0f} h")
print(f"TCPI to finish on budget: {(BAC - EV) / (BAC - AC):.2f}")Project length: 13 weeks A Order beta parts ES 0 EF 3 LS 2 LF 5 float 2 B Beta PCB layout ES 0 EF 2 LS 0 LF 2 float 0 critical C Beta PCB fab + build ES 2 EF 5 LS 2 LF 5 float 0 critical D Classifier firmware ES 0 EF 5 LS 0 LF 5 float 0 critical E Power-mode firmware ES 0 EF 3 LS 2 LF 5 float 2 F Integrate beta node ES 5 EF 7 LS 5 LF 7 float 0 critical G Lab verification ES 7 EF 9 LS 7 LF 9 float 0 critical H Field trial (2 weeks) ES 9 EF 11 LS 10 LF 12 float 1 I Final report ES 9 EF 12 LS 9 LF 12 float 0 critical J Demo day prep ES 12 EF 13 LS 12 LF 13 float 0 critical CV -43 h, SV -28 h, CPI 0.79, SPI 0.85 EAC = BAC / CPI = 531 h (overrun 111 h), ETC 326 h TCPI to finish on budget: 1.20
The winter term schedule is 13 weeks long. The critical path runs through the beta PCB layout, fabrication and build, the classifier firmware, integration, lab verification, the final report and demo preparation. Two things surprised the team. First, the classifier firmware is critical: it takes as long as the board design and build combined, so any slip in Amira's work moves demo day. Second, the final report is critical and the field trial is not. The report takes three weeks after lab verification, while the trial takes two and has a week of float. Students tend to think of reports as something to do at the end; the schedule shows that the report must start in parallel with testing, or it will set the end date.
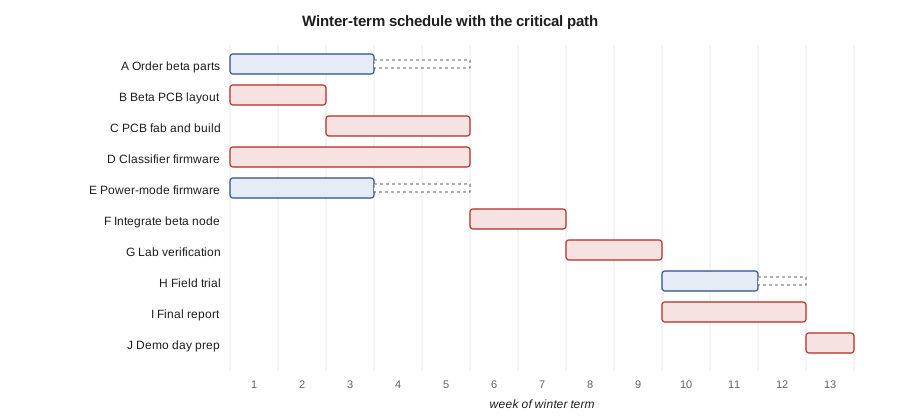
A Gantt chart draws the same schedule as bars on a timeline. It is the most common schedule view because it is easy to read, but it can hide dependencies; the network calculation is what identifies the critical path. Good practice is to compute the schedule with CPM and present it as a Gantt chart with the critical path highlighted, as in the figure.
Worked problem
Absorbing a delay
The beta parts order (task A) is delayed by 3 weeks because a regulator is out of stock. Does demo day move?
Show solution
- From the CPM table, task A has ES = 0, LS = 2, so its float is 2 weeks.
- A 3-week delay exceeds the float by 1 week.
- \[\text{project delay} = \max(0,\ 3 - 2) = 1\ \text{week}\]
- Task A becomes critical, integration starts in week 6 instead of week 5, and the project finishes in week 14 unless another task is shortened.
- The team's response was to order a pin-compatible regulator from a second supplier, recovering the delay.
Answer: Yes, by 1 week, unless the team recovers the time; float absorbs only the first 2 weeks of delay.
Estimating and buffering
Schedules are built from estimates, and estimates are uncertain. Lesson 1 introduced three-point estimates. The critical path's length is a sum of uncertain durations, so it is itself uncertain, and its spread grows with the number of tasks. Two habits help. Estimate with the people who will do the work, not for them, and ask for a range rather than a single number. Then protect the end date with explicit buffers rather than padding every task, because padded tasks tend to expand to fill their padding. The TrailCount team put a one-week buffer before the test readiness review and kept the 15 % capacity reserve from lesson 1, rather than inflating individual estimates.
Hardware lead times deserve special attention. Ordering a custom circuit board, waiting for fabrication and assembling it typically takes two to three weeks even with an express service, and longer if parts must be sourced. The team planned exactly two board revisions, alpha and beta, and treated a third as a contingency that would consume the buffer. They also learned a trick from Northway: order the long-lead parts for beta at the same time as the alpha board, at small extra cost, so that only the board itself is on the critical path for beta.
The money budget
Most capstone courses give each team a budget for parts and services; the client may add parts or money. The TrailCount team had $1,500 from the department and agreed with Northway that Northway would supply the radar modules and gateway access. Lucas kept the budget in the bill of materials spreadsheet, with columns for quantity, unit price, supplier, order date, received date and actual cost, and a summary that compared committed and actual spending with the plan.
| Category | Planned | Committed by week 12 | Notes |
|---|---|---|---|
| Development kits and evaluation boards | $260 | $238 | Microcontroller kit, LoRa kit |
| Alpha PCB fabrication and assembly (3 boards) | $290 | $312 | Express fabrication after a layout fix |
| Beta PCB fabrication and assembly (5 boards) | $340 | $340 | Ordered with long-lead parts |
| Batteries, panels, enclosures, glands | $330 | $356 | Two extra cells for cold testing |
| Pre-compliance chamber rental | $150 | $150 | Half day |
| Contingency | $130 | $0 | Held by the project manager |
| Total | $1,500 | $1,396 |
Two distinctions matter. Committed cost counts money promised by an order even if the invoice has not arrived; actual cost counts money spent. A team that tracks only actual cost can overspend badly before the invoices catch up. And development cost is different from unit cost. The $1,500 pays for building three alpha boards, five beta boards and the test equipment; requirement SYS-09 concerns the bill of materials for one production unit at a quantity of 100, which the team tracked in a separate costed bill of materials.
Earned value management
Schedules and budgets each tell half the story. A team that has spent 50 % of its hours at the midpoint might be exactly on plan, or it might have completed only 30 % of the work. Earned value management (EVM) answers the real question, how much work is done compared with how much should be done and how much it cost, using three numbers measured in the same units, here person-hours.
- Planned value (PV): the budgeted cost of the work scheduled to be done by now.
- Earned value (EV): the budgeted cost of the work actually completed by now.
- Actual cost (AC): what the completed work actually cost.
From these come the variances and indices. Schedule variance SV = EV − PV and cost variance CV = EV − AC are negative when the project is behind or over budget. The schedule performance index SPI = EV / PV and the cost performance index CPI = EV / AC are below 1 when performance is worse than planned. A common forecast of the estimate at completion assumes the cost efficiency so far continues: EAC = BAC / CPI, where BAC is the budget at completion. The to-complete performance index, TCPI = (BAC − EV) / (BAC − AC), says how efficient the remaining work must be to finish on budget.
The key to honest earned value is the rule for crediting work. Partial credit based on someone's feeling that a task is 80 % done is notoriously optimistic; tasks seem to stay 90 % done for weeks. The TrailCount team used a 0 or 100 rule for small tasks (credit only when the task meets its definition of done) and a 50/50 rule for tasks longer than two weeks (half credit at start, half at completion).
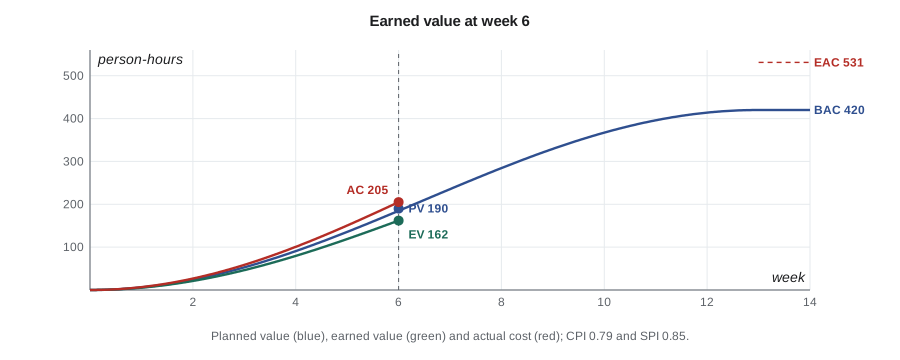
At week 6 of the winter term, the numbers were sobering. The team had planned to complete 190 hours of work, had completed work worth 162 hours, and had spent 205 hours doing it. SPI = 0.85 means work is getting done at 85 % of the planned rate; CPI = 0.79 means each hour of effort is producing only 0.79 hours of planned work. If that continues, the term's work will take 531 hours instead of 420, an overrun of 111 hours that the four students did not have. Finishing within the budget would require a TCPI of 1.20, working 20 % more efficiently than planned for the rest of the term, which is rarely realistic.
The value of EVM is that it raised this alarm in week 6, not week 12. At the next advisor meeting, the team traced most of the cost overrun to the classifier: tuning it on field recordings was taking far longer than estimated. Two decisions followed. Lucas and Jonah each took one classifier task, using the float in their own work. And the team asked Ines to move SYS-11, over-the-air firmware updates, from the pilot scope to future work, replacing it with signed updates over a local service connection. That change request cut 60 hours from the remaining work. It is the kind of conversation that goes well in week 6 and badly in week 12.
Reporting status
Lucas sent a one-page status report to Professor Osei and Ines every two weeks, in the same format each time: overall status (green, amber or red, with a one-line reason), progress against milestones, the EVM indices, the top three risks, decisions needed from the client, and the plan for the next two weeks. The format matters less than the honesty. A status report that says amber with a clear reason and a plan earns more trust than a stream of greens followed by a red the week before the review.
Common mistakes
MistakeBuilding a schedule as a list of dates without dependencies.
InsteadBuild a dependency network, compute the critical path and float, and present it as a Gantt chart.
MistakeTreating the final report as an end-of-project task.
InsteadSchedule the report in parallel with testing; it is often on the critical path.
MistakePadding every task estimate.
InsteadEstimate realistically with ranges and protect the end date with explicit buffers and a reserve.
MistakeMeasuring progress by hours spent.
InsteadUse earned value: compare completed work with planned work and with actual cost.
MistakeCrediting partial progress by feel.
InsteadUse 0 or 100 credit for small tasks and a fixed rule such as 50/50 for longer ones.
Summary and key terms
- A work breakdown structure divides scope into deliverable-oriented pieces, following the 100 % rule.
- The critical path method uses forward and backward passes to find the longest dependency chain and each task's float.
- Delays on the critical path move the end date; delays off it are absorbed up to the task's float.
- Protect the end date with explicit buffers, plan board revisions and order long-lead parts early.
- Track committed and actual spending, and keep development cost separate from production unit cost.
- Earned value combines schedule and cost: SPI = EV / PV, CPI = EV / AC, EAC = BAC / CPI and TCPI = (BAC − EV) / (BAC − AC).
- Work breakdown structure (WBS)
- A hierarchical, deliverable-oriented decomposition of a project's total scope.
- Critical path
- The longest chain of dependent tasks, which sets the project's minimum duration.
- Float
- The time a task can be delayed without delaying the project end date.
- Gantt chart
- A schedule drawn as bars on a timeline.
- Planned value (PV)
- The budgeted cost of the work scheduled to be complete at a given date.
- Earned value (EV)
- The budgeted cost of the work actually complete at a given date.
- Cost performance index (CPI)
- Earned value divided by actual cost; below 1 means over budget.
- Estimate at completion (EAC)
- A forecast of total cost at completion, often BAC / CPI.
Practice problems
Work each problem on paper first, then reveal the answer to check.
A task has ES = 4, EF = 7, LS = 6 and LF = 9. What is its float, and is it critical?
Show answer
Float = LS − ES = 2 weeks; it is not critical.
PV = 300 h, EV = 270 h, AC = 250 h. Find SPI and CPI, and interpret them.
Show answer
SPI = 0.90 (behind schedule) and CPI = 1.08 (under budget): the team is efficient but started some work late.
BAC = 600 h and CPI = 0.80. What is the EAC?
Show answer
600 / 0.80 = 750 h.
Why does the field trial have float in the TrailCount schedule while the final report does not?
Show answer
Both start after lab verification, but the trial takes 2 weeks and the report 3, and demo preparation needs both, so the trial can slip 1 week without moving the end date.
Lesson quiz · 5 questions
Score 60% or more to complete this lesson.
Create a free account to save your progress, take quizzes and earn a certificate.