
CIV-470 · Lesson 12 of 12 · 19 min
Capstone: climate adaptation and the Kestrel Creek master plan
The master plan comes together in this lesson. Its works will last 50 to 100 years: a culvert designed now will see the climate of the 2080s, and a dam spillway longer still. Anika's final task for the team is to test every recommendation against a changing climate, rank the projects for the city's capital program, and write the plan so that the next engineer can see what was assumed and why. The lesson treats climate adaptation as a design discipline rather than a forecast: the climate cannot be predicted precisely, but the designs can be made robust to a plausible range.
Nonstationarity
Classical hydrology assumes stationarity: that the statistics of rainfall and floods do not change over time, so that the past record describes the future. A warming climate breaks that assumption. Warmer air holds more water vapor, about 7 % more per degree Celsius by the Clausius-Clapeyron relation, and observations and models show the most intense short rainfall bursts increasing at roughly that rate in many regions, sometimes faster. Snow-dominated regions see earlier melt, more winter rain and changed spring floods. Low flows may fall where summers lengthen and evapotranspiration rises. Lake Superior's levels respond to the whole basin's balance and have ranged widely within the past few decades.
Design responses fall into three groups. Climate-informed design adjusts the design rainfall or flow with change factors from climate projections. Robust design chooses works that perform acceptably across a range of futures, even if not optimally in any one. Adaptive design builds now for a moderate future but leaves room to upgrade, for example by reserving land, oversizing foundations or designing a berm that can be raised, with triggers that say when to act.
US guidance includes NOAA Atlas 14, whose Volume 8 covered Minnesota and the Midwest in 2013, and its successor NOAA Atlas 15, designed to include climate trends and projected change, with a pilot in 2024 and preliminary nationwide estimates scheduled for review in 2026. FHWA's Highways in the River Environment (HEC-17), in its second edition, sets out risk-based and climate-informed approaches for highway hydraulics, and its vulnerability assessment framework guides transportation agencies. Minnesota's state agencies publish climate projections and resilience guidance for local governments.
Risk over the design life
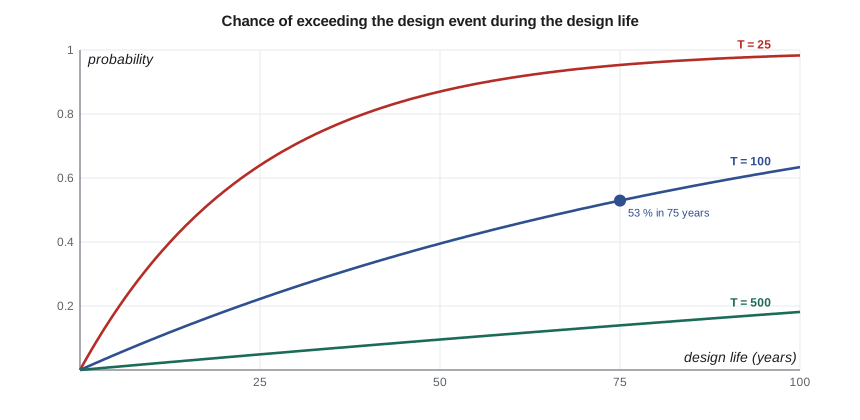
A return period describes a probability per year, not a schedule. The chance that the \(T\)-year event is equalled or exceeded at least once in an \(n\)-year design life is
A culvert designed for the 100-year flood with a 75-year life has better than even odds of seeing its design flood. That is not a design failure, since the design flood is supposed to be survivable with freeboard, but it is a reason to check performance above the design flood and to make that performance graceful: overtopping of the road rather than washout of the embankment, controlled flooding of a yard rather than of buildings.
# Climate adaptation for the Kestrel Creek master plan: design-life risk, rainfall change and priorities
UNITS = "US"
SI = UNITS == "SI"
def risk(T, n): return 1 - (1 - 1 / T) ** n
print("Chance that the design event is equalled or exceeded at least once during the design life")
for T in (25, 100, 500):
    print(f"  T = {T:3d} years: 25 years {risk(T, 25):5.1%}, 50 years {risk(T, 50):5.1%}, 75 years {risk(T, 75):5.1%}")
# rainfall scaling: about 7 % more short-duration intensity per degree C of warming (an assumption to test)
for dT in (1.5, 2.5, 3.5):
    print(f"Warming {dT} C: rainfall factor {1.07 ** dT:.2f}")
# runoff amplification with the curve number method (CN 75, 100-year 24-hour depth from CIV-370)
P = 95.3 if SI else 3.75
CN = 75
S = (25400 / CN - 254) if SI else (1000 / CN - 10)
def runoff(p): return (p - 0.2 * S) ** 2 / (p + 0.8 * S) if p > 0.2 * S else 0.0
q0 = runoff(P)
for fac in (1.10, 1.15, 1.27):
    print(f"  rainfall x {fac:.2f}: runoff {runoff(P*fac):.1f} {'mm' if SI else 'in.'} against {q0:.1f} -> x {runoff(P*fac)/q0:.2f}")
# master plan priorities: risk reduced per dollar, with a minimum score for the environment
projects = [("culvert 4.5 x 2.4 m with fish passage", 1650, 8.5, 9),
            ("Kestrel Lake dam spillway widening", 820, 7.0, 4),
            ("Hillside Road bridge pier scour protection", 210, 5.5, 5),
            ("operations site LID retrofit", 480, 3.5, 8),
            ("floodplain buyout of two houses", 900, 4.0, 7),
            ("two supply wells for drought backup", 560, 6.0, 5)]
print("\nproject                                     cost ($k)  risk score  env score  score per $M")
for name, cost, rk, env in sorted(projects, key=lambda p: -(p[2] + 0.5 * p[3]) / p[1]):
print(f" {name:42s} {cost:6,d} {rk:4.1f} {env:3d} {(rk + 0.5 * env) / cost * 1000:5.1f}")Chance that the design event is equalled or exceeded at least once during the design life T = 25 years: 25 years 64.0%, 50 years 87.0%, 75 years 95.3% T = 100 years: 25 years 22.2%, 50 years 39.5%, 75 years 52.9% T = 500 years: 25 years 4.9%, 50 years 9.5%, 75 years 13.9% Warming 1.5 C: rainfall factor 1.11 Warming 2.5 C: rainfall factor 1.18 Warming 3.5 C: rainfall factor 1.27 rainfall x 1.10: runoff 1.8 in. against 1.5 -> x 1.19 rainfall x 1.15: runoff 1.9 in. against 1.5 -> x 1.29 rainfall x 1.27: runoff 2.3 in. against 1.5 -> x 1.52 project cost ($k) risk score env score score per $M Hillside Road bridge pier scour protection 210 5.5 5 38.1 operations site LID retrofit 480 3.5 8 15.6 two supply wells for drought backup 560 6.0 5 15.2 Kestrel Lake dam spillway widening 820 7.0 4 11.0 floodplain buyout of two houses 900 4.0 7 8.3 culvert 4.5 x 2.4 m with fish passage 1,650 8.5 9 7.9
Reading the results
The design-life table shows a 53 % chance that the 100-year flood will be exceeded at least once in 75 years, and a 14 % chance even for the 500-year flood. Applying 7 % per degree Celsius to warming of 1.5 to 3.5 °C (2.7 to 6.3 °F) gives rainfall factors of 1.11 to 1.27. Runoff amplifies the change: with the curve number method on the 100-year 24-hour rainfall of 3.75 in., a 15 % increase in rainfall raises runoff by 29 %, and a 27 % increase raises it by 52 %. That amplification is why CIV-370's climate-check flow of 850 cfs, a third higher than the 640 cfs 100-year flow, is a sensible test for the creek crossings.
Testing each recommendation
| Work | Design basis | Climate check | Adaptive provision |
|---|---|---|---|
| Ridgeway Road culvert, 15 × 8 ft embedded | Q100 with freeboard; fish passage flows | passes the +33 % flow with 1.3 ft freeboard | road profile allows controlled overtopping |
| Kestrel Lake spillway, 39 ft crest | inflow design flood | PMF fails by a small margin | abutment space reserved for a fuse plug |
| Hillside Road bridge | scour countermeasures now | scour rises with flow | single span on piles at replacement |
| Operations center stormwater | pond for Q100; LID for volume | pond spillway checked for +33 % | land reserved to enlarge the pond |
| Co-op supply | lake plus two wells | longer droughts tested by simulation | third well site reserved |
| Floodplain | regulation, two voluntary buyouts | flood lines mapped for the +33 % flow | berm designed to be raised |
The table shows the plan's character. Most works are sized for today's standards but checked against a future flow, and almost all keep an option open: space for a fuse plug at the dam, land beside the pond, a third well site, a berm whose crest can be raised. Those options cost little now and make the plan adaptive. The one exception is the culvert, which is hard to enlarge later, so its size is set by the climate check, not by the present 100-year flow alone.
Ranking the projects
The city cannot fund everything at once. The team scores each project on the risk it reduces and on its environmental benefit, and divides by cost to rank them. The code's ranking puts the Hillside Road scour protection first, a small, cheap project that removes a serious risk to the only access road, followed by the stormwater retrofit and the wells. The culvert comes last per dollar, because it is expensive.
A pure ranking would be misleading. The culvert must be replaced anyway because of its condition and its failure as a fish barrier, and lesson 10 showed that the extra cost of the larger size pays for itself in avoided flood damage. The plan therefore separates mandatory projects, those driven by regulation, condition or safety, from discretionary ones, and ranks only the latter by value for money. Engineers should present scoring as an aid to judgment, show the scores and weights openly, and test whether the order changes when the weights change.
Worked problem
Design-life risk
A storm sewer is designed for the 5-year storm and a 50-year life. A dam spillway is designed for a flood with an annual exceedance probability of 1 in 3,000 and a 100-year life. Find the chance that each design event is exceeded at least once during the life.
Show solution
- \[R_{\text{sewer}} = 1 - (1 - 0.2)^{50} = 1 - 1.4 \times 10^{-5} \approx 1.0\]
- \[R_{\text{spillway}} = 1 - \Big(1 - \frac{1}{3000}\Big)^{100} = 1 - 0.967 = 0.033\]
Answer: The sewer will certainly surcharge many times, which is why the major system matters; the spillway's design flood has about a 3 % chance in a century, consistent with its role in protecting lives.
The master plan report
The plan's report records the problem, the data, the assumptions, the alternatives considered and the reasons for the recommendations, so that the city, the agencies and future engineers can follow them. Its structure for Kestrel Creek is: objectives and engagement; existing conditions, with the water balance, the flow regime, the crossings, the dam, the floodplain and the stream's condition; future conditions, including growth and climate; the alternatives for each element and their evaluation; the recommended plan with costs and priorities; the approvals each project needs; monitoring, including streamflow, piezometers, the dam's instruments, the bridge's bed and the creek's fish; and the triggers that would prompt the next review.
The approvals list includes an amended water appropriation permit for the co-op and the wells, DNR dam safety and public waters work permits for the spillway and the creek works, a Section 404 permit from the Corps for fill in the creek, the MPCA construction stormwater permit, a conditional letter of map revision from FEMA for the culvert's effect on flood levels, and the city's floodplain ordinance for the berm. The plan's environmental documentation supports any state environmental review that the larger projects trigger.
Monitoring and review
An adaptive plan is only adaptive if someone watches. The team recommends a stream gauge at Ridgeway Road, which also improves future flood frequency estimates; a rain gauge at the operations center; piezometers between the wells and the lift station with trigger levels; the dam's piezometers and seepage weir; a bed survey at the Hillside Road bridge each spring; and fish surveys above and below the new crossing to confirm that brook trout are moving through it. The plan is reviewed every ten years, or sooner if a trigger is reached: a flood exceeding the climate-check flow, a drought deeper than the design drought, a change in standards, or new climate projections that move the design values materially.
Practical points
- Test every design against a plausible future, not only the past record.
- Express risk over the design life; a 100-year design is likely to be exceeded in a long life.
- Keep options open at low cost: land, foundations, crest heights that can be raised.
- Separate mandatory from discretionary projects before ranking by value for money.
- Write down assumptions, monitoring and triggers so that the plan can adapt.
Common mistakes
MistakeTreating the 100-year flood as an event that happens once a century.
InsteadIt has a 1 % chance every year and about a 53 % chance over 75 years.
MistakeApplying a rainfall change factor directly to flows.
InsteadRunoff responds more than rainfall; run the change through the hydrology.
MistakeRanking all projects by benefit per dollar regardless of obligations.
InsteadSeparate regulatory, condition and safety needs from optional projects.
MistakeDesigning for one projected climate as if it were certain.
InsteadUse a range and prefer robust and adaptive designs.
Summary and key terms
- Climate change makes hydrologic statistics nonstationary; intense short rainfall rises roughly 7 % per degree of warming.
- Designs can be climate-informed, robust or adaptive, and the best plans combine all three.
- The chance of exceeding the \(T\)-year event in \(n\) years is \(1 - (1 - 1/T)^n\).
- Runoff amplifies rainfall change: a 15 % rainfall increase raises Kestrel Creek runoff by about 29 %.
- The master plan tests each work against the climate check and keeps low-cost options for later upgrades.
- Mandatory projects are separated from discretionary ones before ranking; monitoring and triggers keep the plan adaptive.
- Stationarity
- The assumption that the statistics of a hydrologic variable do not change over time.
- Change factor
- A multiplier applied to a design value to represent a projected future climate.
- Robust design
- Design that performs acceptably across a range of possible futures.
- Adaptive design
- Design that can be upgraded when monitored conditions reach defined triggers.
- Design life
- The period over which a work is expected to perform its function.
- Clausius-Clapeyron relation
- The physical relation by which saturated air holds about 7 % more water vapor per degree Celsius.
- Climate check
- A test of a design against a flow or rainfall representing a plausible future climate.
- Trigger
- A monitored condition that prompts a review or upgrade of a plan or work.
Practice problems
Work each problem on paper first, then reveal the answer to check.
Find the chance that the 50-year flood is exceeded at least once in 30 years.
Show answer
\(1 - 0.98^{30} = 0.45\).
Warming of 2.0 °C is projected. Using 7 % per degree, find the rainfall factor.
Show answer
\(1.07^{2.0} = 1.145\).
Why is the culvert sized for the climate-check flow while the pond is sized for today's 100-year flow with land reserved?
Show answer
The culvert is very costly to enlarge later, while the pond can be expanded onto reserved land if monitoring shows it is needed.
Name three triggers that should prompt a review of the master plan.
Show answer
A flood above the climate-check flow, a drought deeper than the design drought, and a material change in standards or climate projections.
Lesson quiz · 5 questions
Score 60% or more to complete this lesson.
Create a free account to save your progress, take quizzes and earn a certificate.